 6
6peptides
spectra
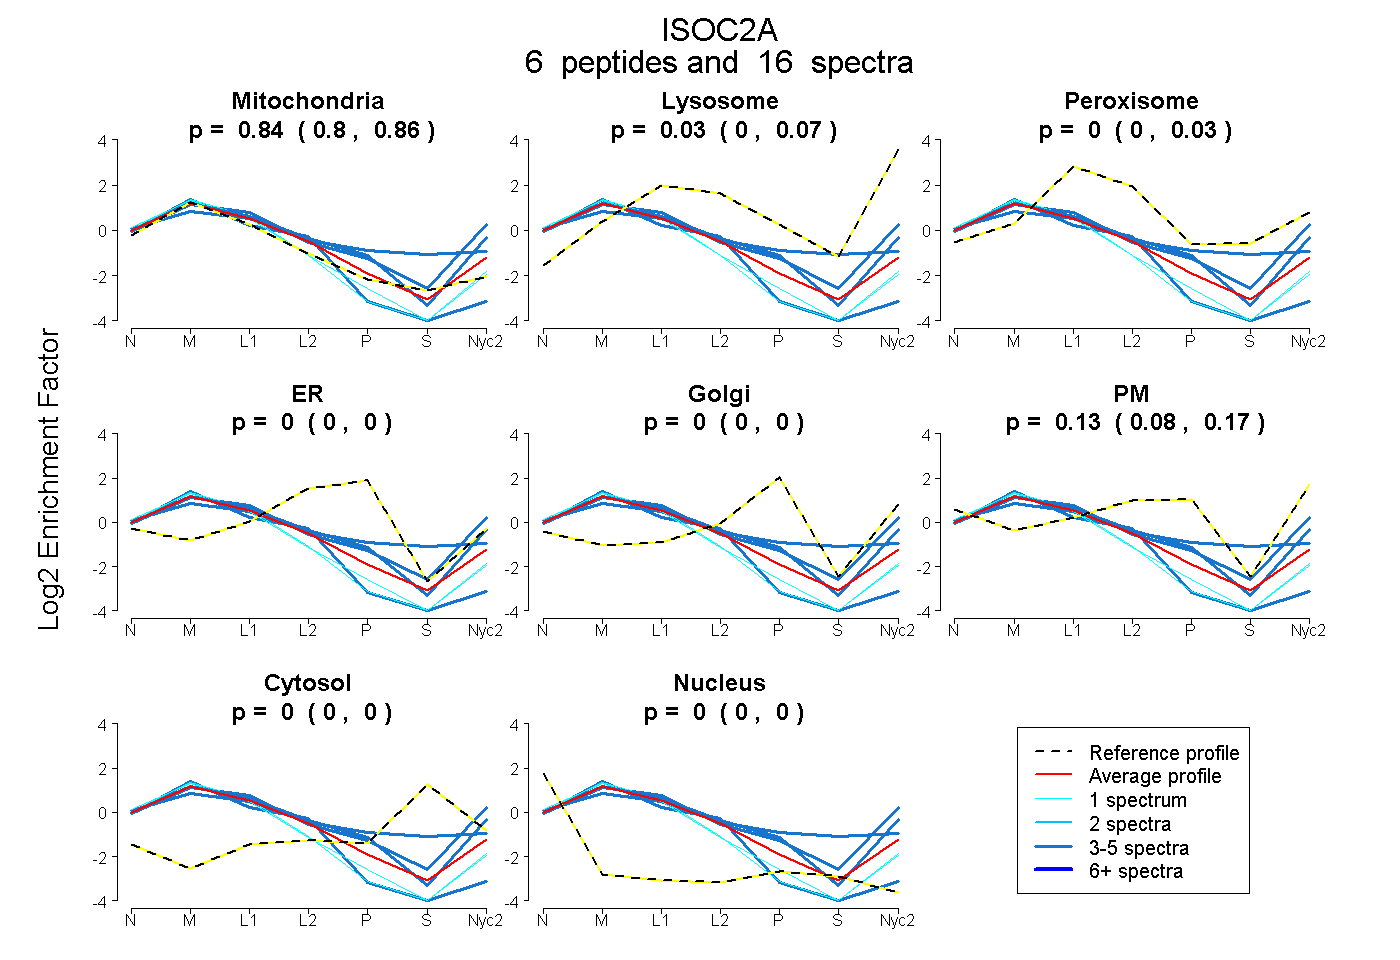
0.797 | 0.863
0.000 | 0.068
0.000 | 0.034
0.000 | 0.000
0.000 | 0.000
0.085 | 0.168
0.000 | 0.000
0.000 | 0.000
3peptides
spectra
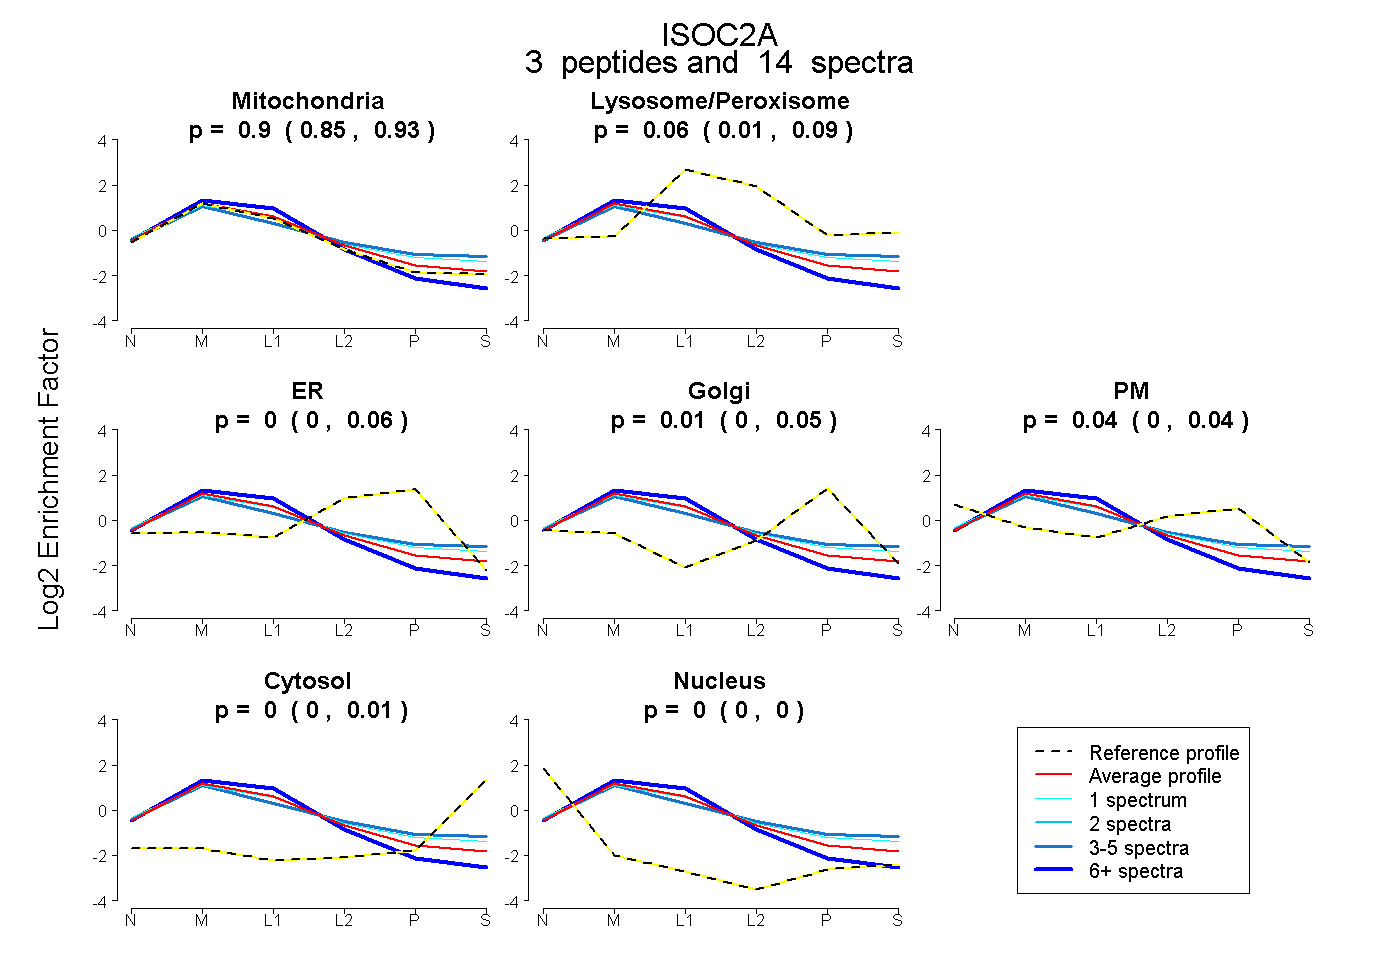
0.850 | 0.933
0.009 | 0.093
0.000 | 0.064
0.000 | 0.050
0.000 | 0.040
0.000 | 0.010
0.000 | 0.000
7peptides
spectra
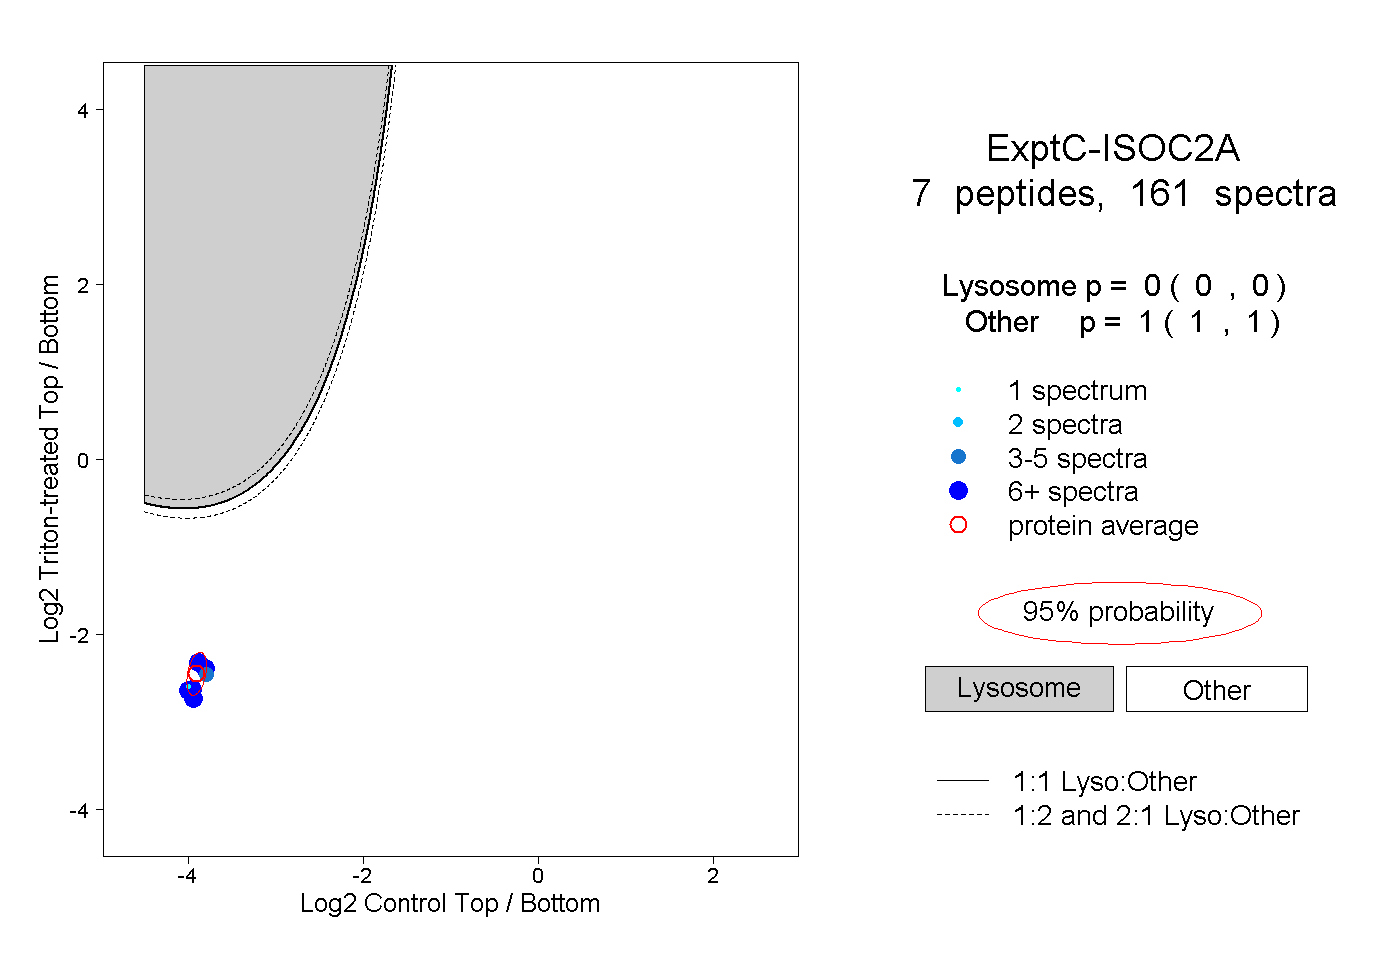
0.000 | 0.000
1.000 | 1.000
1peptide
spectra
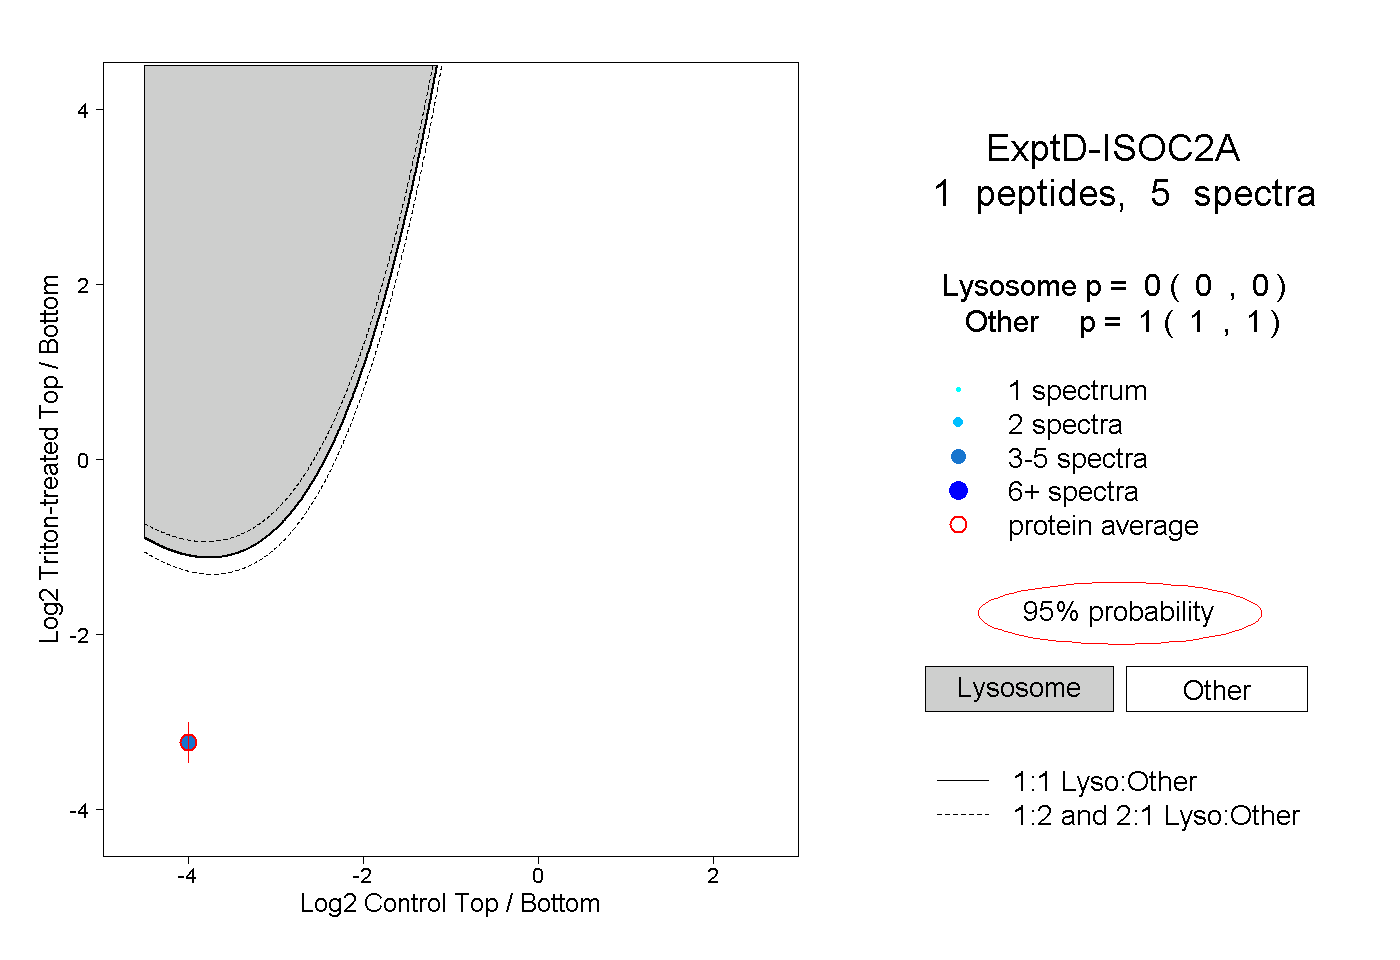
0.000 | 0.000
1.000 | 1.000