 6
6peptides
spectra
0.797 | 0.863
0.000 | 0.068
0.000 | 0.034
0.000 | 0.000
0.000 | 0.000
0.085 | 0.168
0.000 | 0.000
0.000 | 0.000
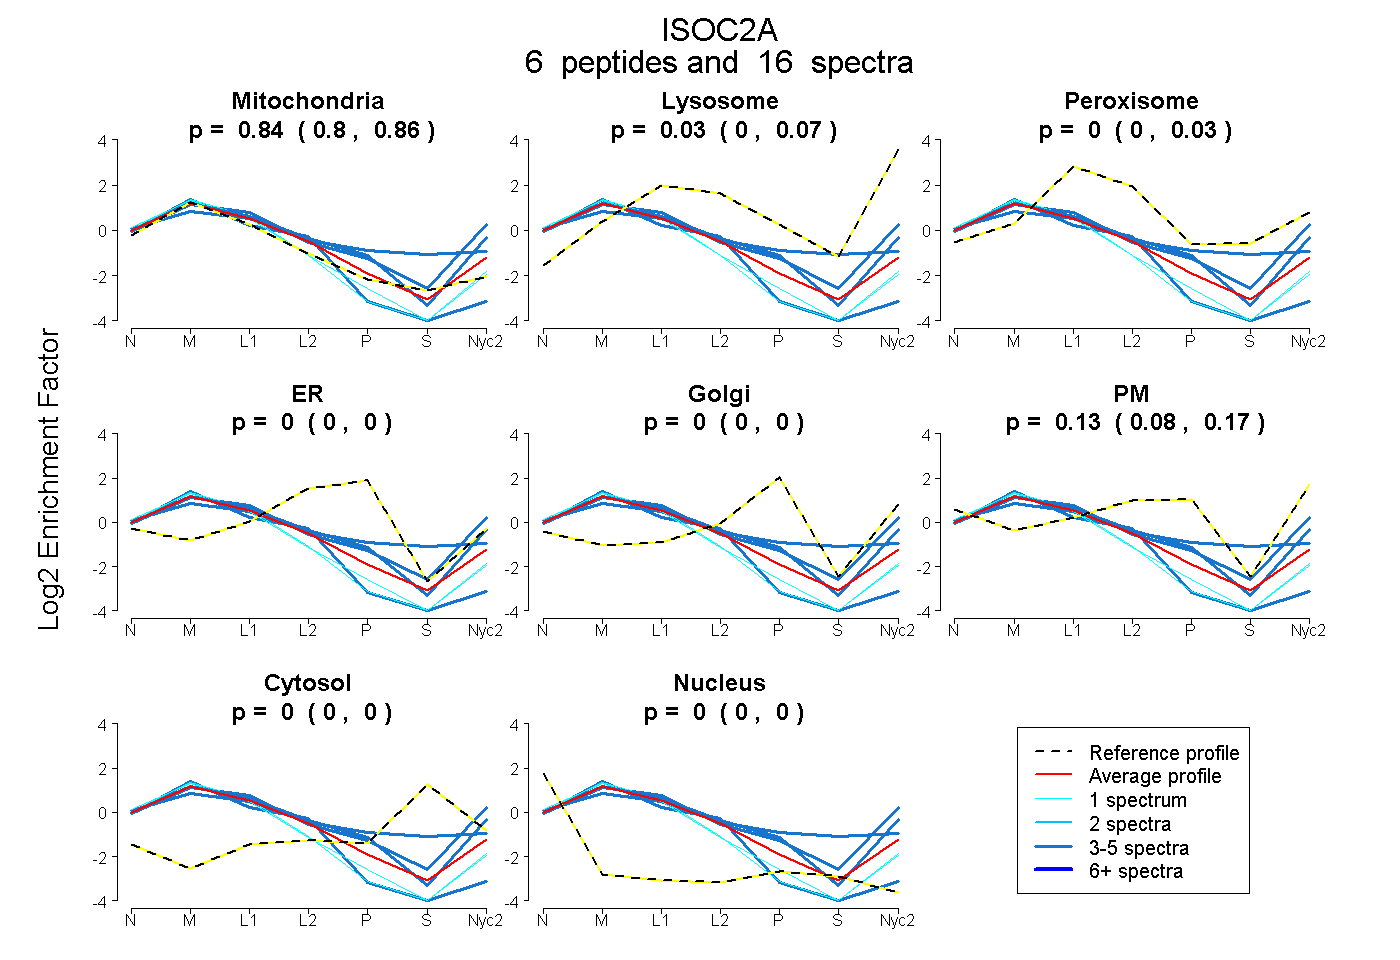
| Plot | Mito | Lyso | Perox | ER | Golgi | PM | Cytosol | Nucleus | |||||
| Expt A |
6 peptides |
16 spectra |
|
0.837 0.797 | 0.863 |
0.032 0.000 | 0.068 |
0.000 0.000 | 0.034 |
0.000 0.000 | 0.000 |
0.000 0.000 | 0.000 |
0.131 0.085 | 0.168 |
0.000 0.000 | 0.000 |
0.000 0.000 | 0.000 |
| 3 spectra, IRPESSILFLCDMQEK | 0.973 | 0.000 | 0.000 | 0.000 | 0.000 | 0.000 | 0.000 | 0.027 | ||
| 4 spectra, TCFSMVPSLQK | 0.653 | 0.066 | 0.000 | 0.000 | 0.000 | 0.281 | 0.000 | 0.000 | ||
| 3 spectra, GLQVHVVVDACSSR | 0.617 | 0.220 | 0.000 | 0.000 | 0.000 | 0.163 | 0.000 | 0.000 | ||
| 1 spectrum, QSGAFLSTSESLILQLVR | 1.000 | 0.000 | 0.000 | 0.000 | 0.000 | 0.000 | 0.000 | 0.000 | ||
| 1 spectrum, LVALGR | 0.998 | 0.000 | 0.000 | 0.000 | 0.000 | 0.000 | 0.000 | 0.002 | ||
| 4 spectra, DAAHPQFK | 0.528 | 0.000 | 0.215 | 0.000 | 0.032 | 0.090 | 0.134 | 0.000 |
| Plot | Mito | Lyso or Perox | ER | Golgi | PM | Cytosol | Nucleus | ||||||
| Expt B |
3 peptides |
14 spectra |
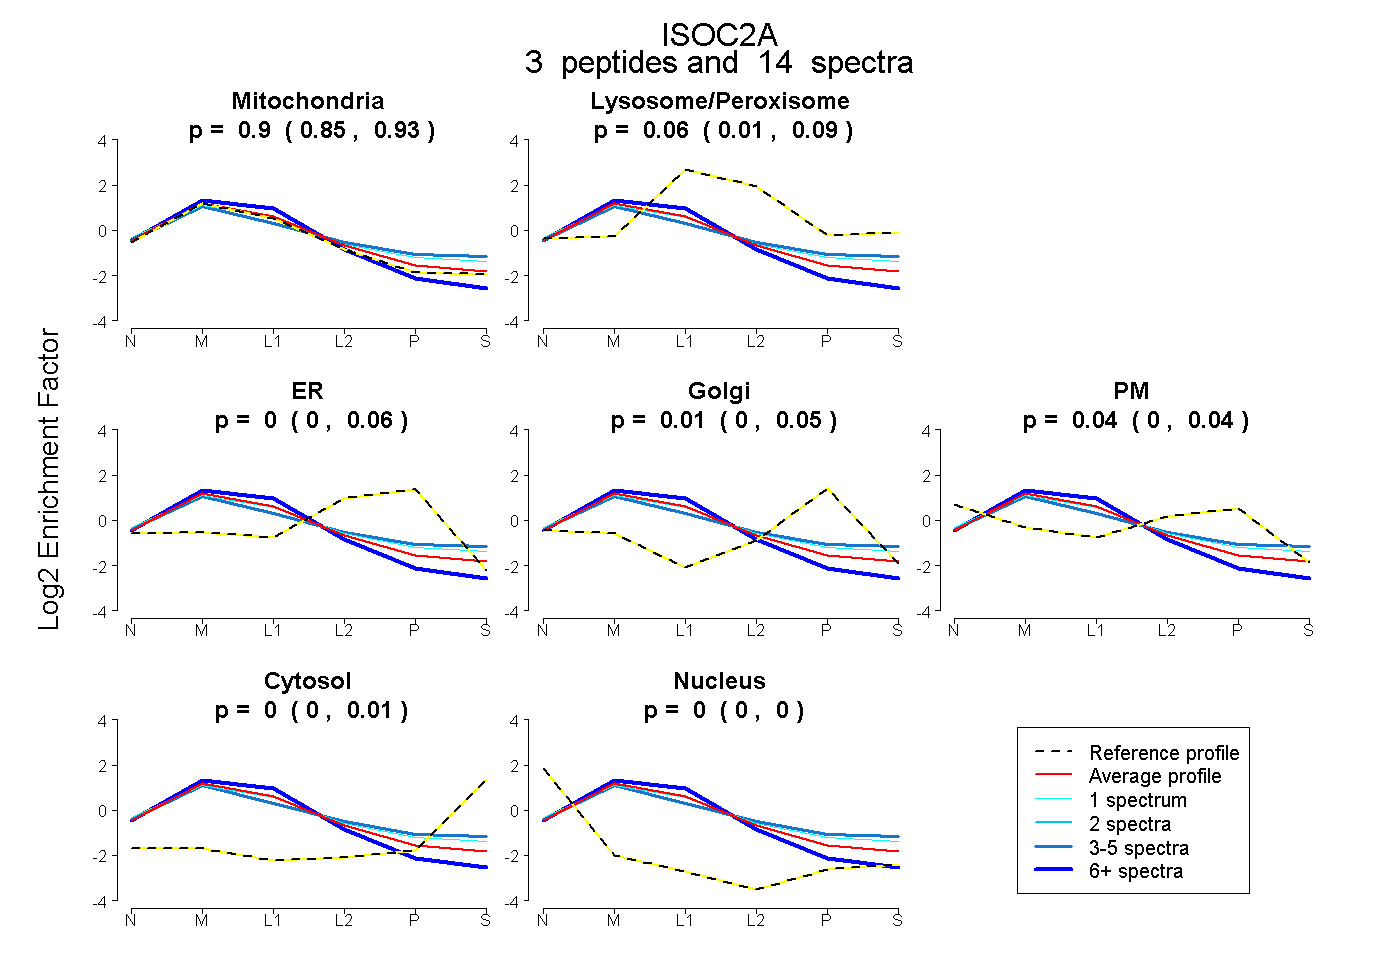 |
0.895 0.850 | 0.933 |
0.055 0.009 | 0.093 |
0.003 0.000 | 0.064 |
0.009 0.000 | 0.050 |
0.037 0.000 | 0.040 |
0.000 0.000 | 0.010 |
0.000 0.000 | 0.000 |
|||
| Plot | Lyso | Other | |||||||||||
| Expt C |
7 peptides |
161 spectra |
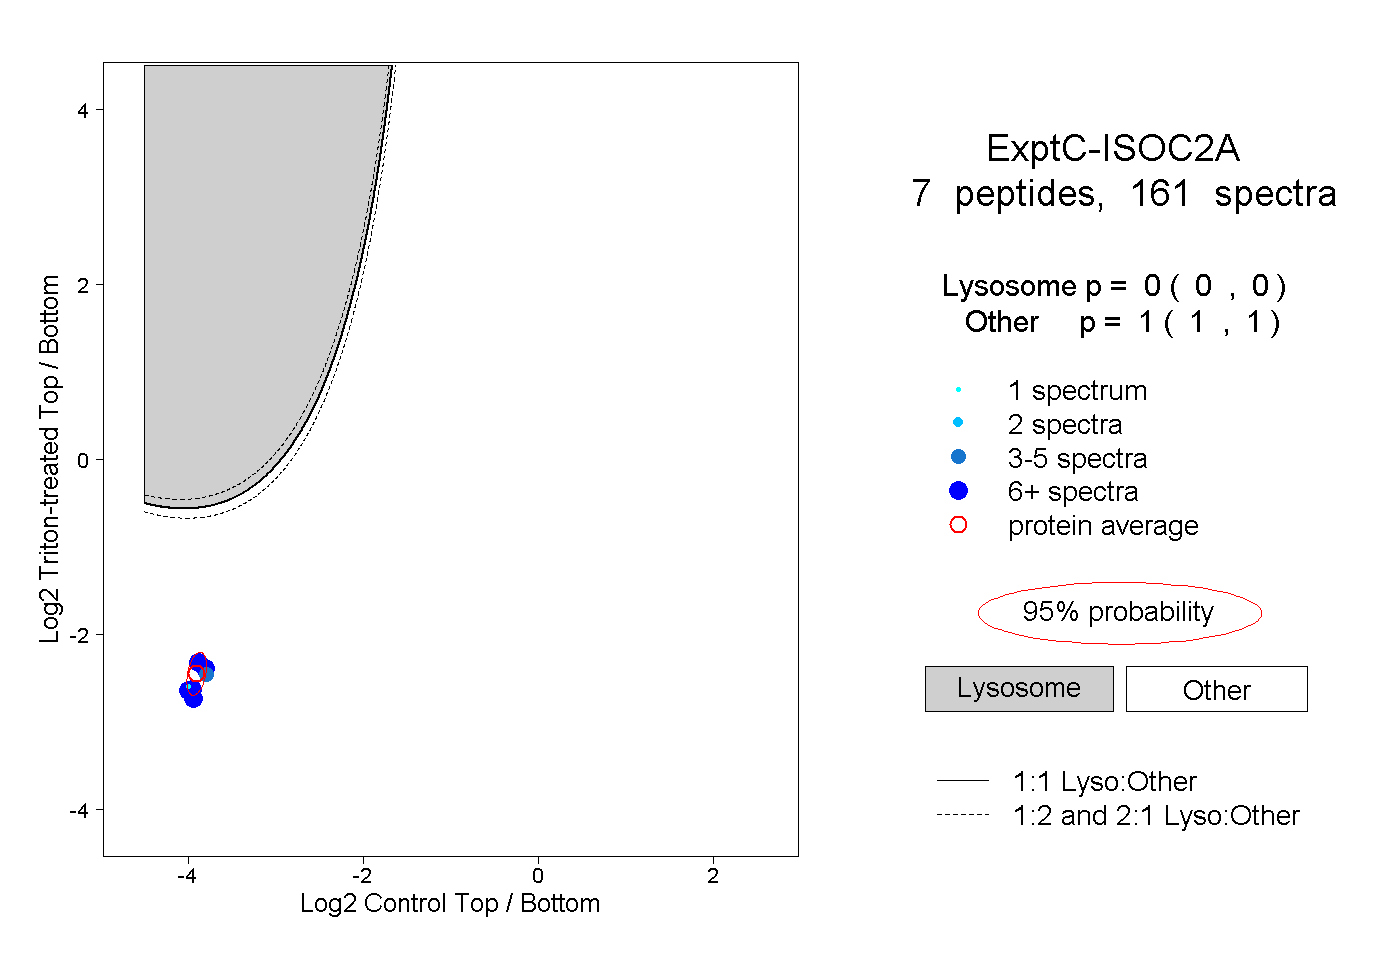 |
0.000 0.000 | 0.000 |
1.000 1.000 | 1.000 |
||||||||
| Plot | Lyso | Other | |||||||||||
| Expt D |
1 peptide |
5 spectra |
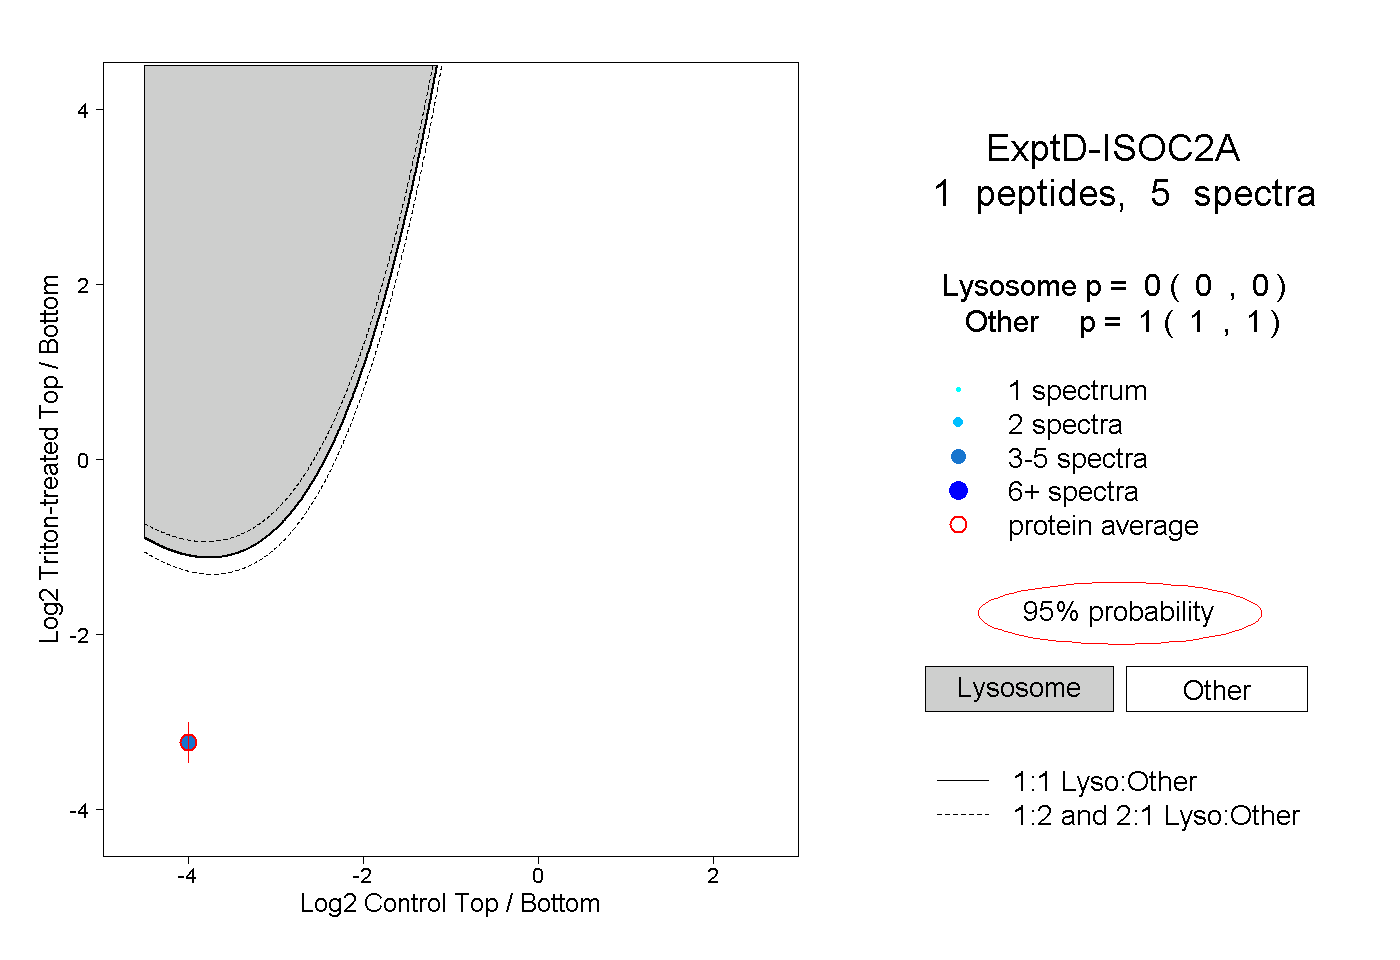 |
0.000 0.000 | 0.000 |
1.000 1.000 | 1.000 |