 3
3peptides
spectra
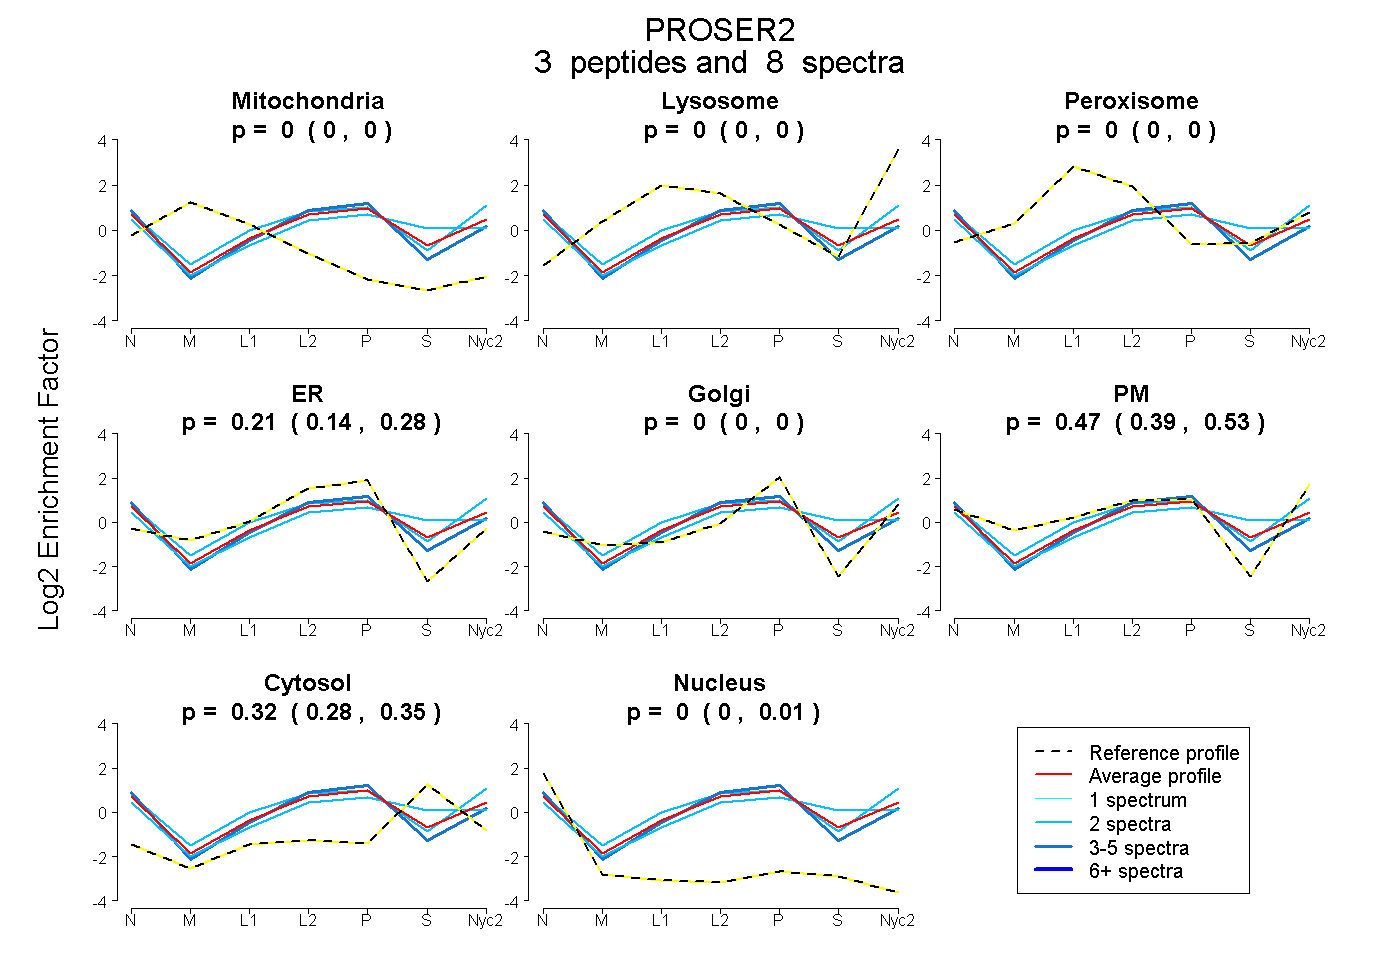
0.000 | 0.000
0.000 | 0.000
0.000 | 0.000
0.139 | 0.278
0.000 | 0.000
0.391 | 0.528
0.279 | 0.346
0.000 | 0.011
1peptide
spectra
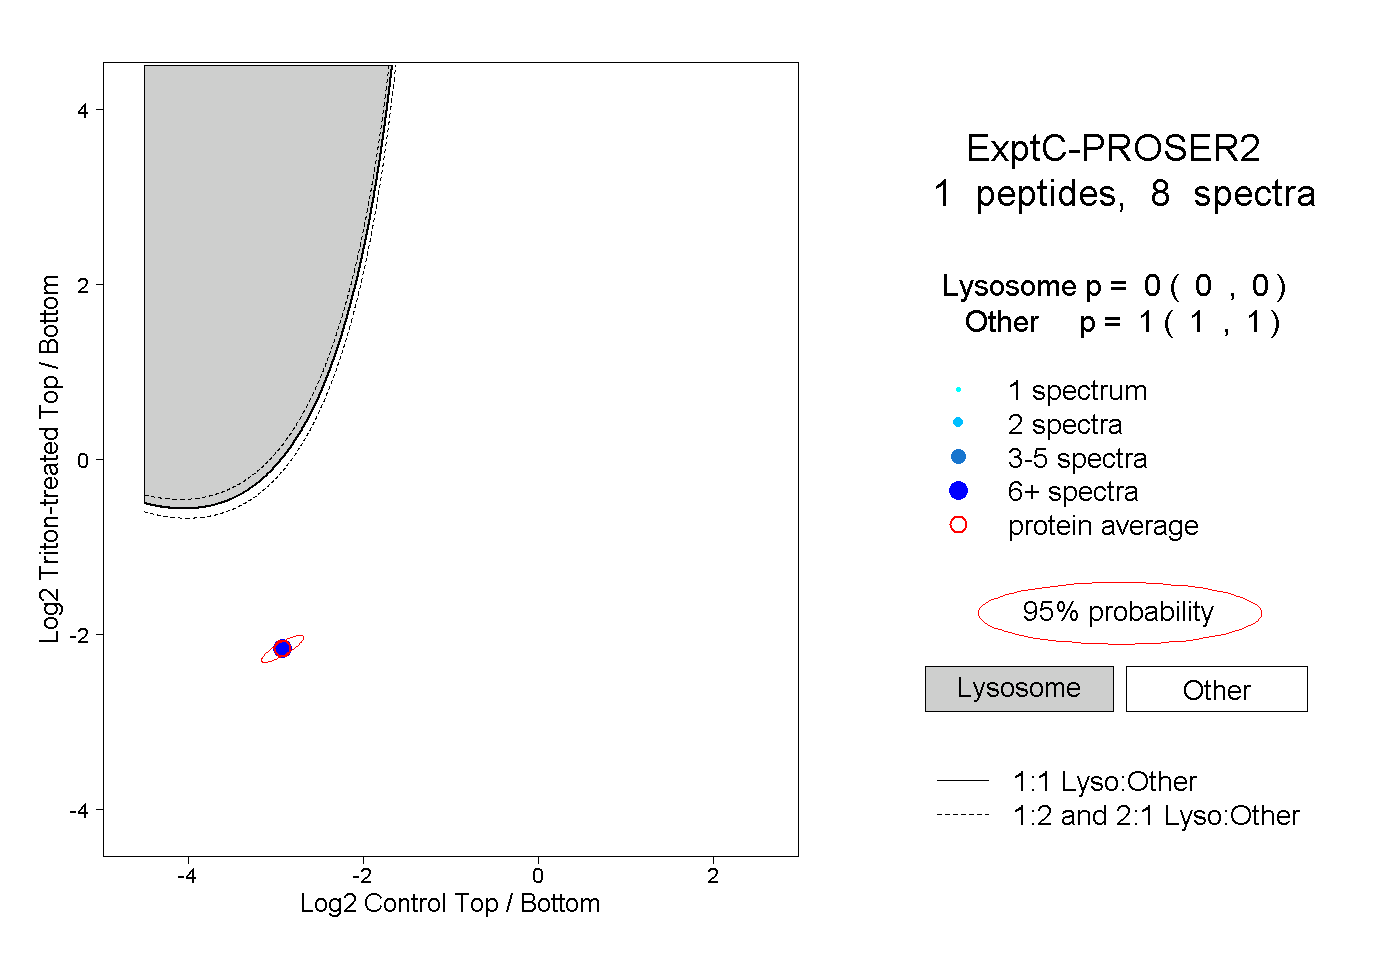
0.000 | 0.000
1.000 | 1.000
1peptide
spectrum
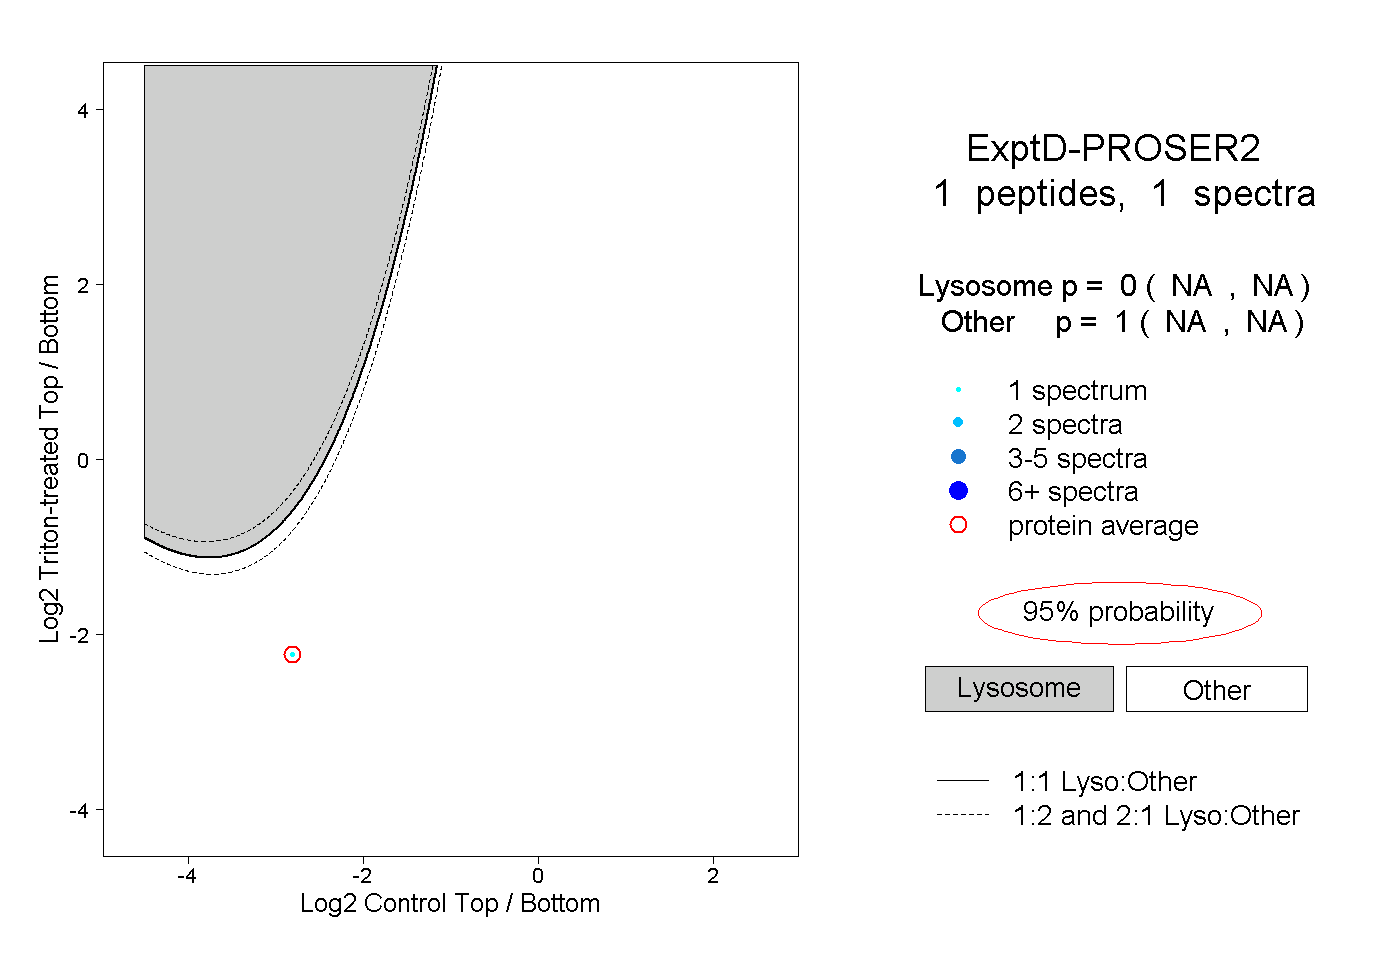
NA | NA
NA | NA