 3
3peptides
spectra
0.000 | 0.000
0.000 | 0.000
0.000 | 0.000
0.139 | 0.278
0.000 | 0.000
0.391 | 0.528
0.279 | 0.346
0.000 | 0.011
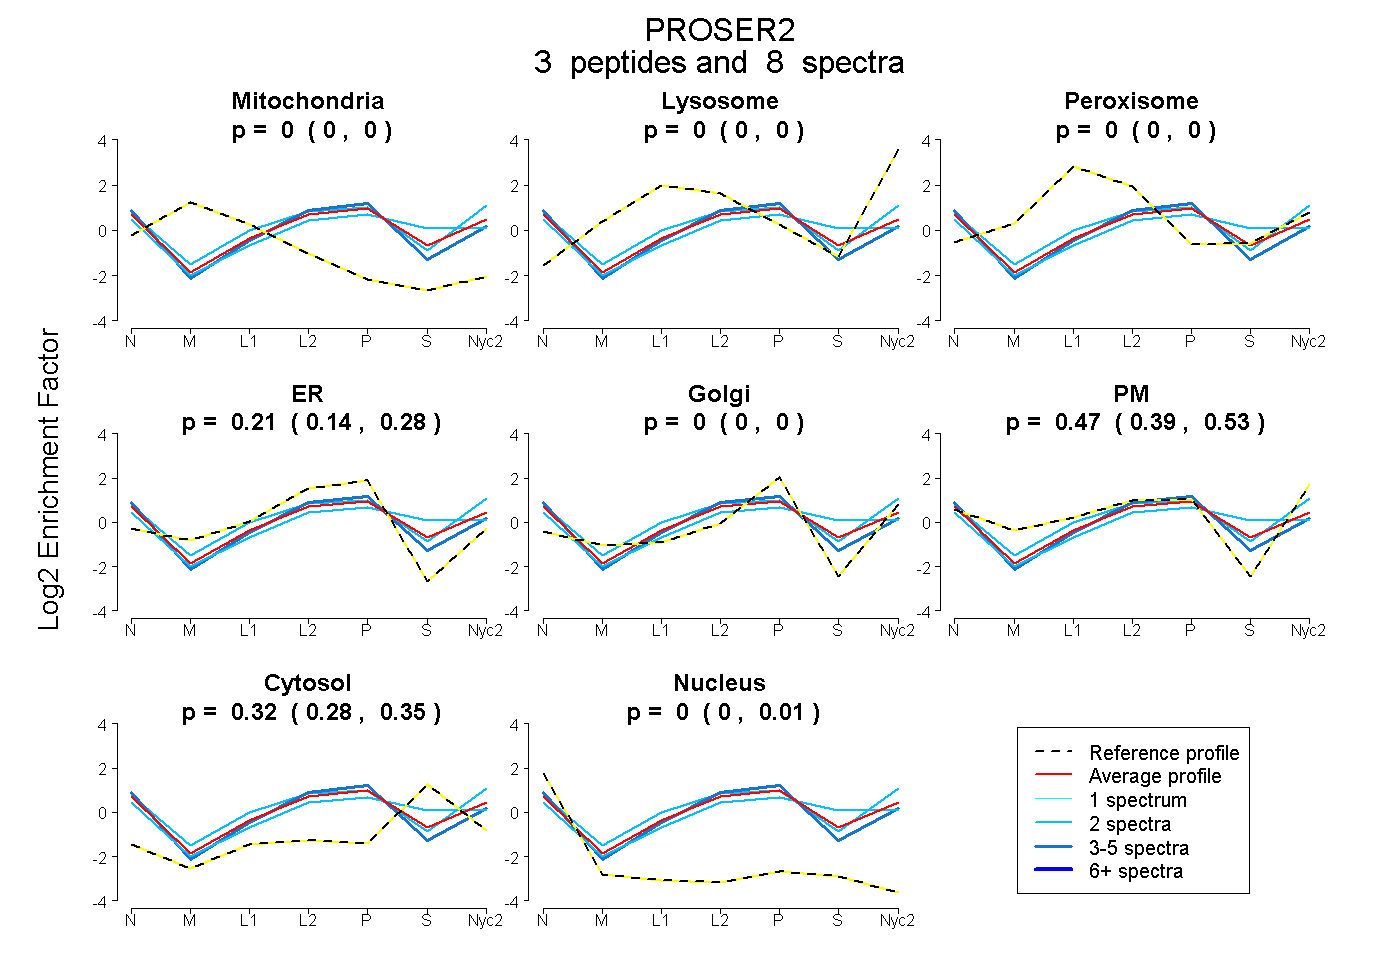
| Plot | Mito | Lyso | Perox | ER | Golgi | PM | Cytosol | Nucleus | |||||
| Expt A |
3 peptides |
8 spectra |
|
0.000 0.000 | 0.000 |
0.000 0.000 | 0.000 |
0.000 0.000 | 0.000 |
0.214 0.139 | 0.278 |
0.000 0.000 | 0.000 |
0.467 0.391 | 0.528 |
0.319 0.279 | 0.346 |
0.000 0.000 | 0.011 |
| 2 spectra, TPTSLASR | 0.000 | 0.000 | 0.000 | 0.184 | 0.000 | 0.347 | 0.469 | 0.000 | ||
| 4 spectra, AVGFRPQGITVQFSGR | 0.000 | 0.000 | 0.000 | 0.391 | 0.000 | 0.349 | 0.207 | 0.053 | ||
| 2 spectra, AAVNVQER | 0.000 | 0.000 | 0.010 | 0.039 | 0.000 | 0.716 | 0.236 | 0.000 |
| Plot | Lyso | Other | |||||||||||
| Expt C |
1 peptide |
8 spectra |
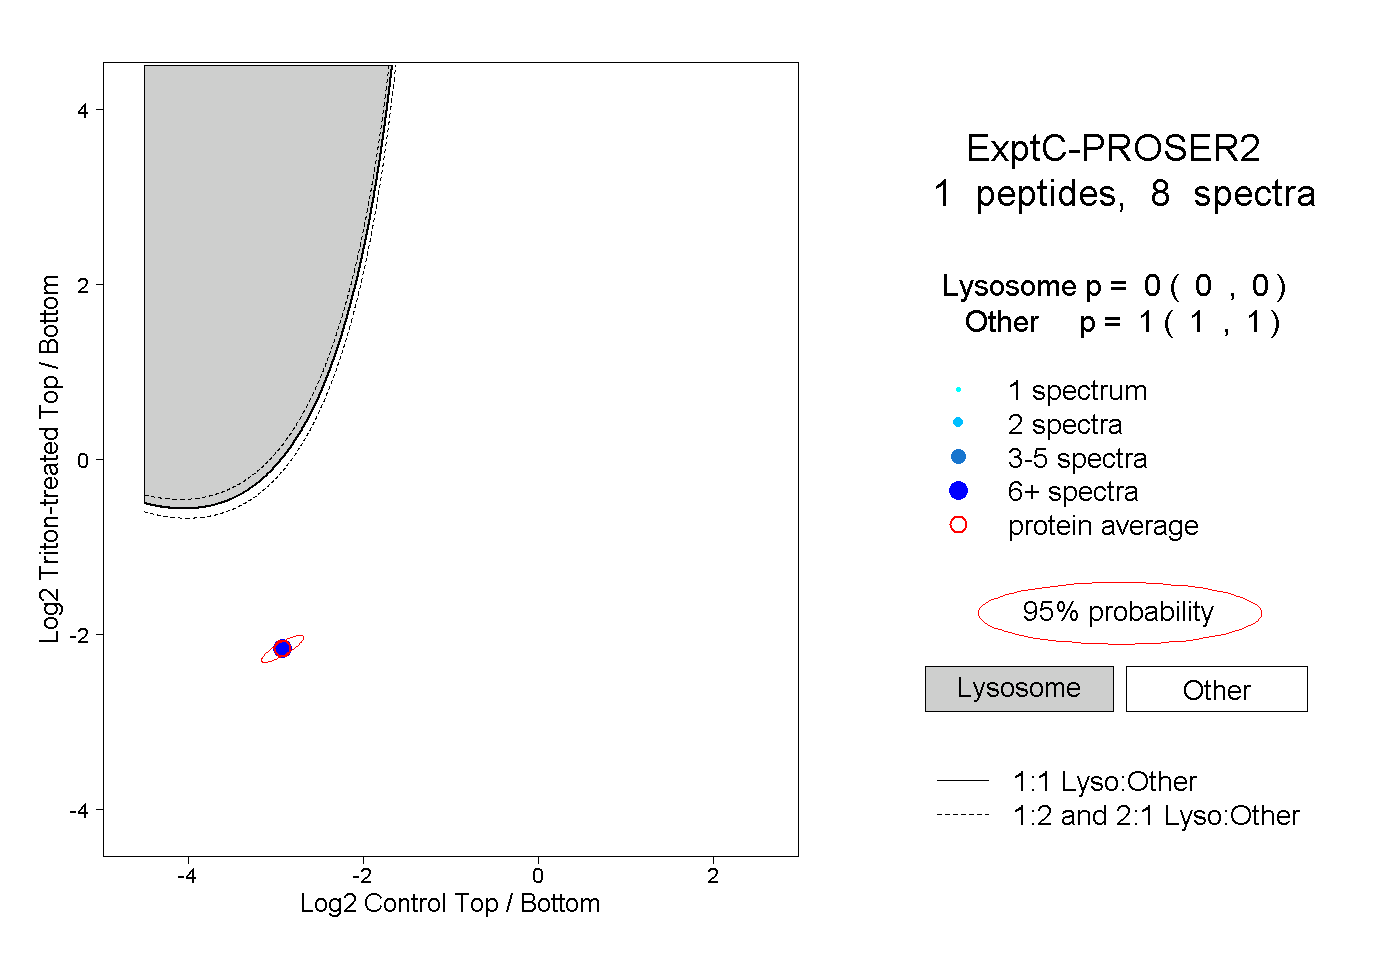 |
0.000 0.000 | 0.000 |
1.000 1.000 | 1.000 |
||||||||
| Plot | Lyso | Other | |||||||||||
| Expt D |
1 peptide |
1 spectrum |
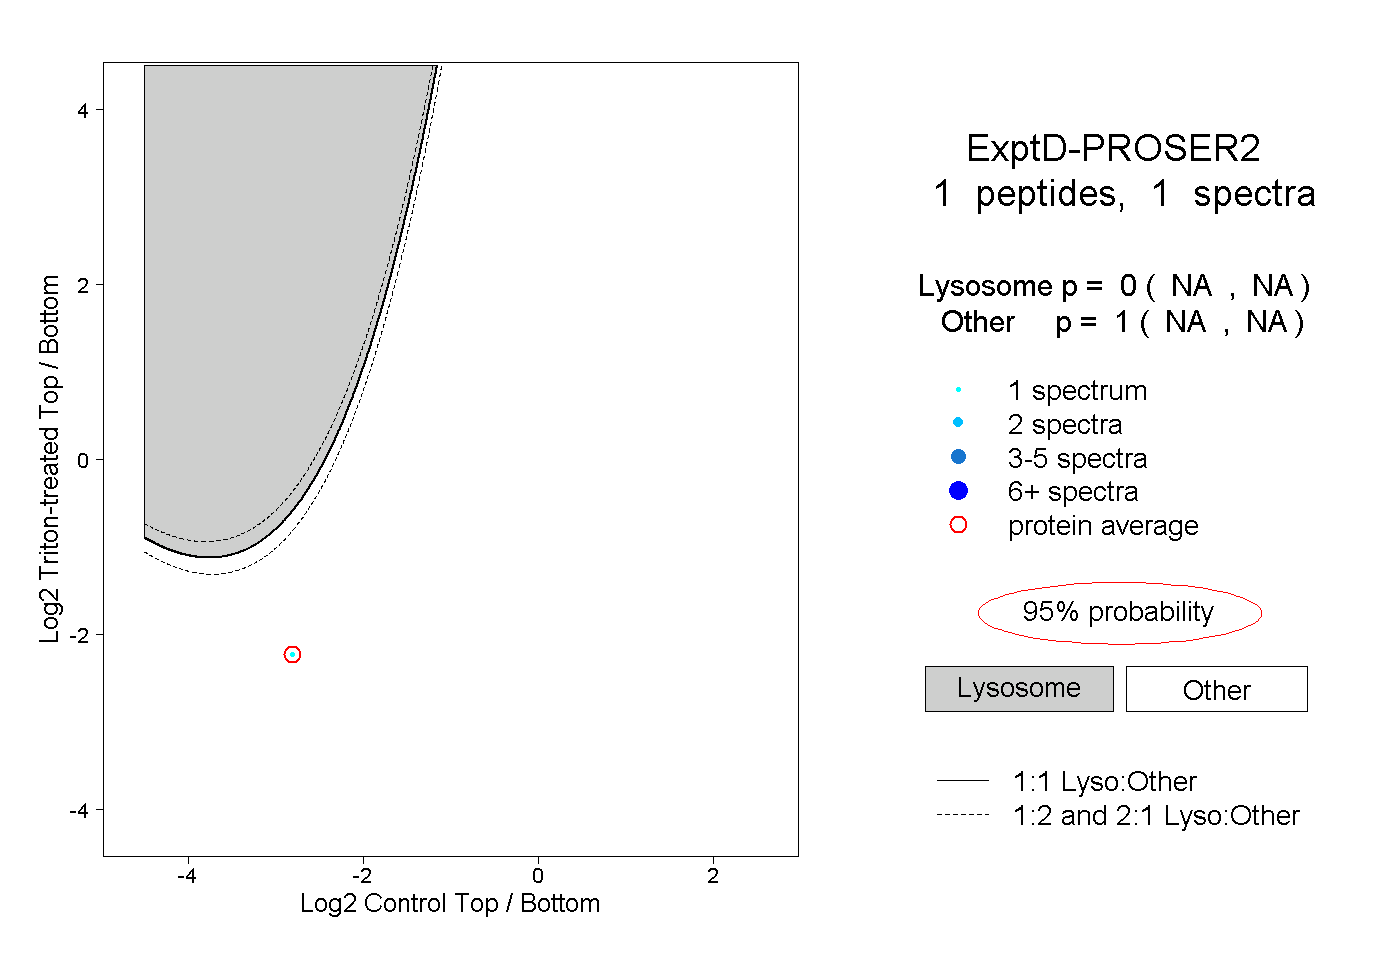 |
0.000 NA | NA |
1.000 NA | NA |