 6
6peptides
spectra
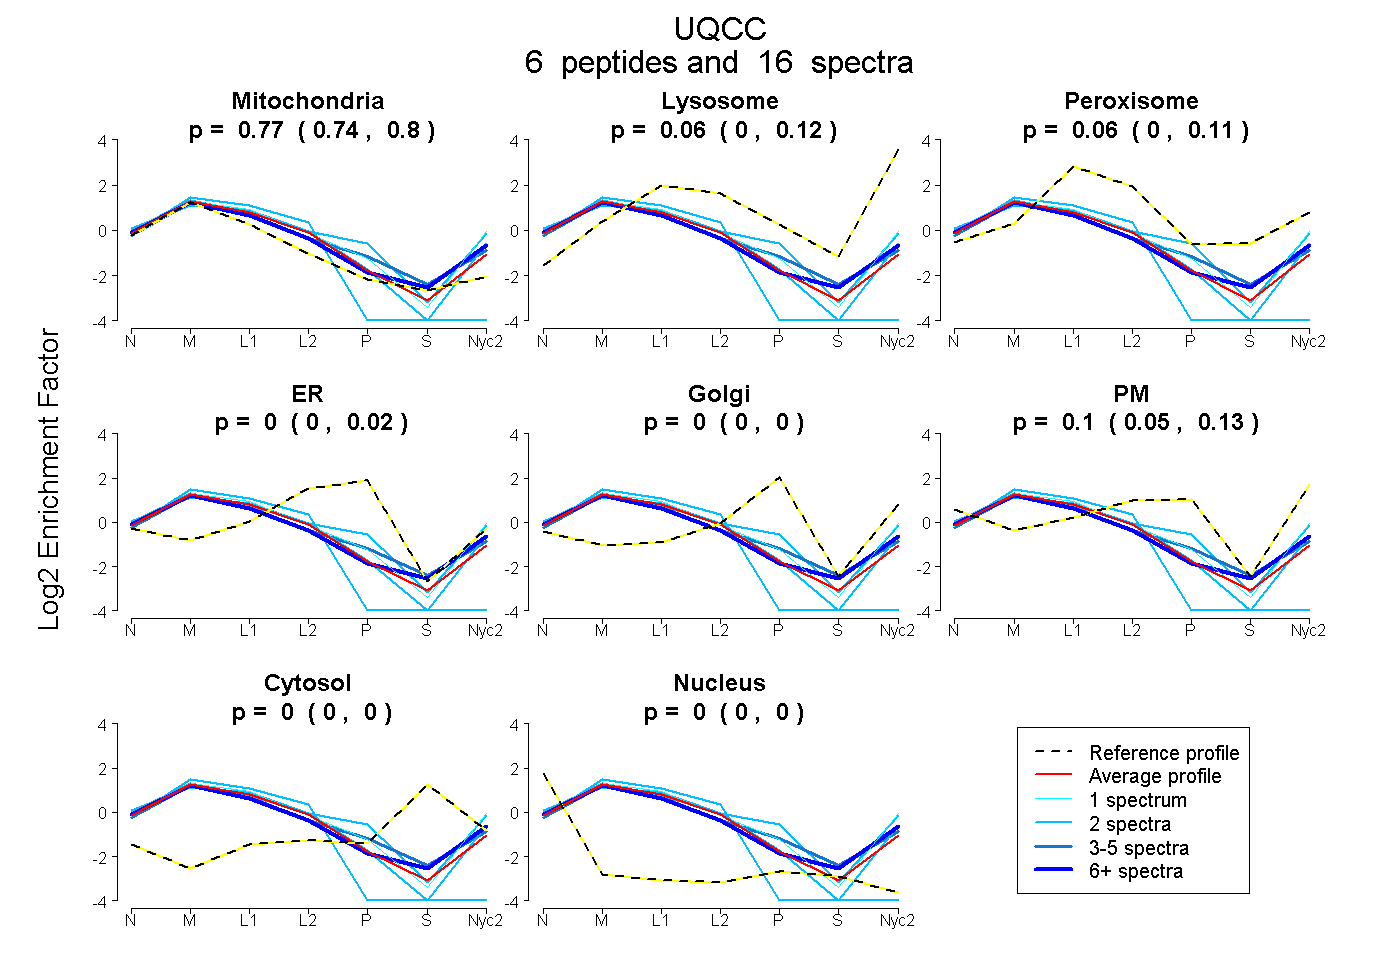
0.742 | 0.800
0.000 | 0.124
0.003 | 0.112
0.000 | 0.021
0.000 | 0.000
0.052 | 0.131
0.000 | 0.000
0.000 | 0.000
3peptides
spectra
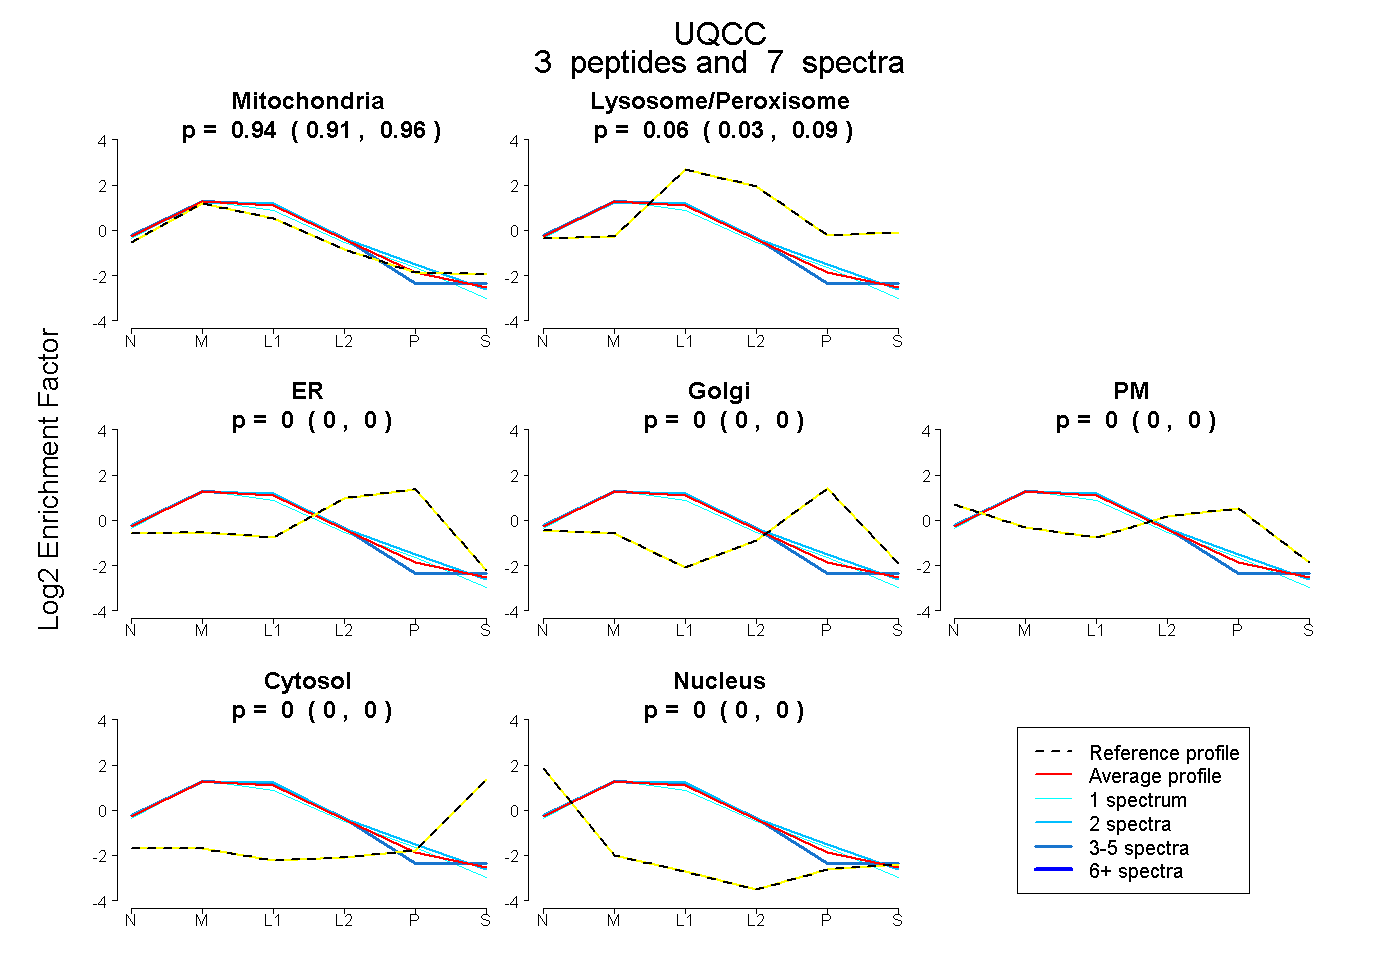
0.908 | 0.963
0.033 | 0.087
0.000 | 0.002
0.000 | 0.000
0.000 | 0.000
0.000 | 0.000
0.000 | 0.000
10peptides
spectra
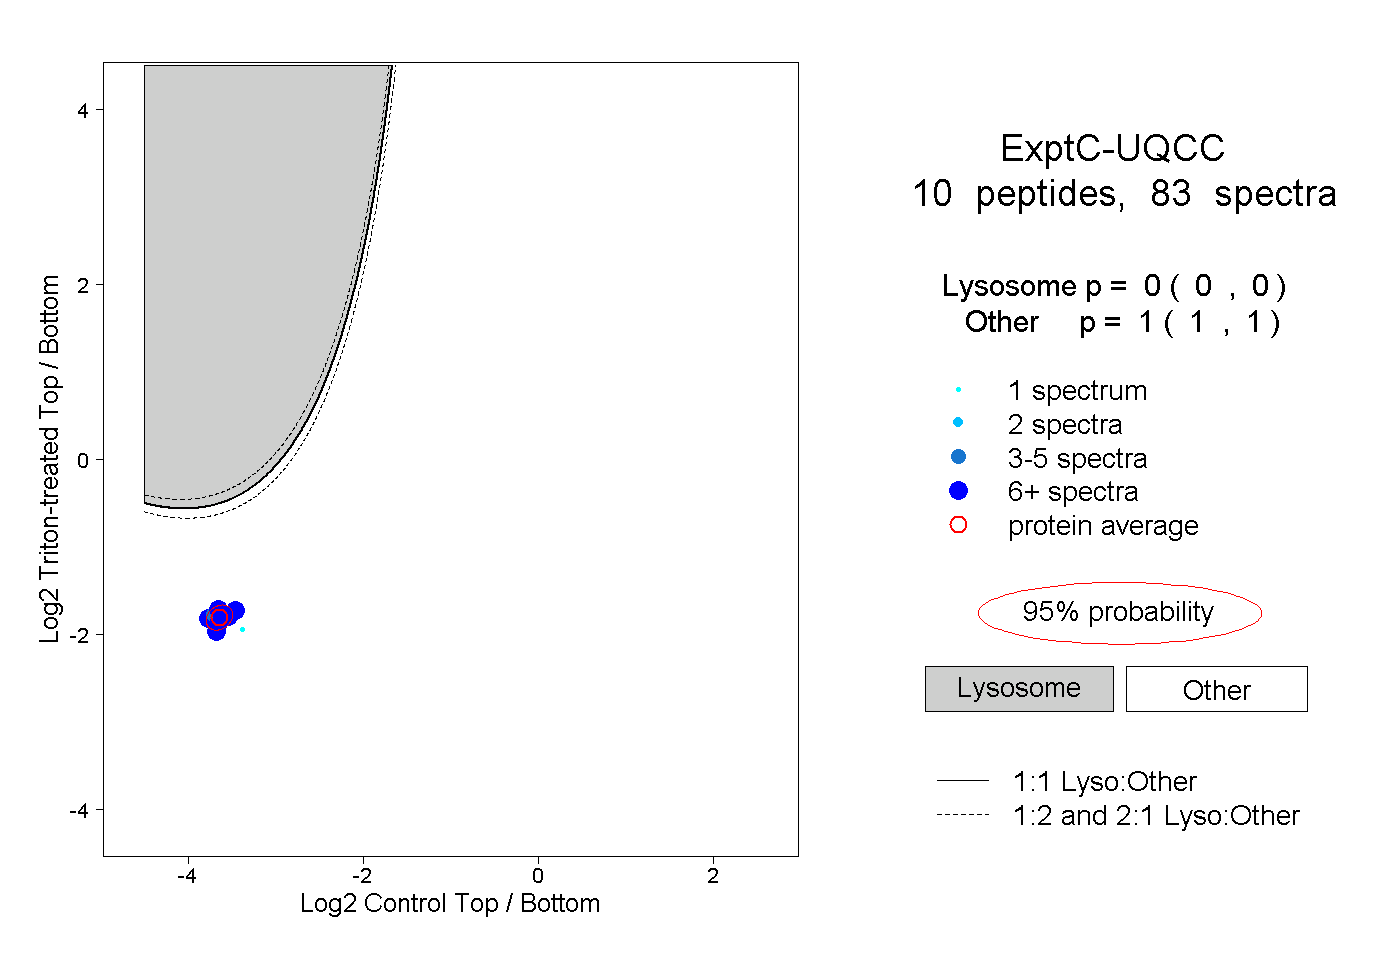
0.000 | 0.000
1.000 | 1.000
4peptides
spectra
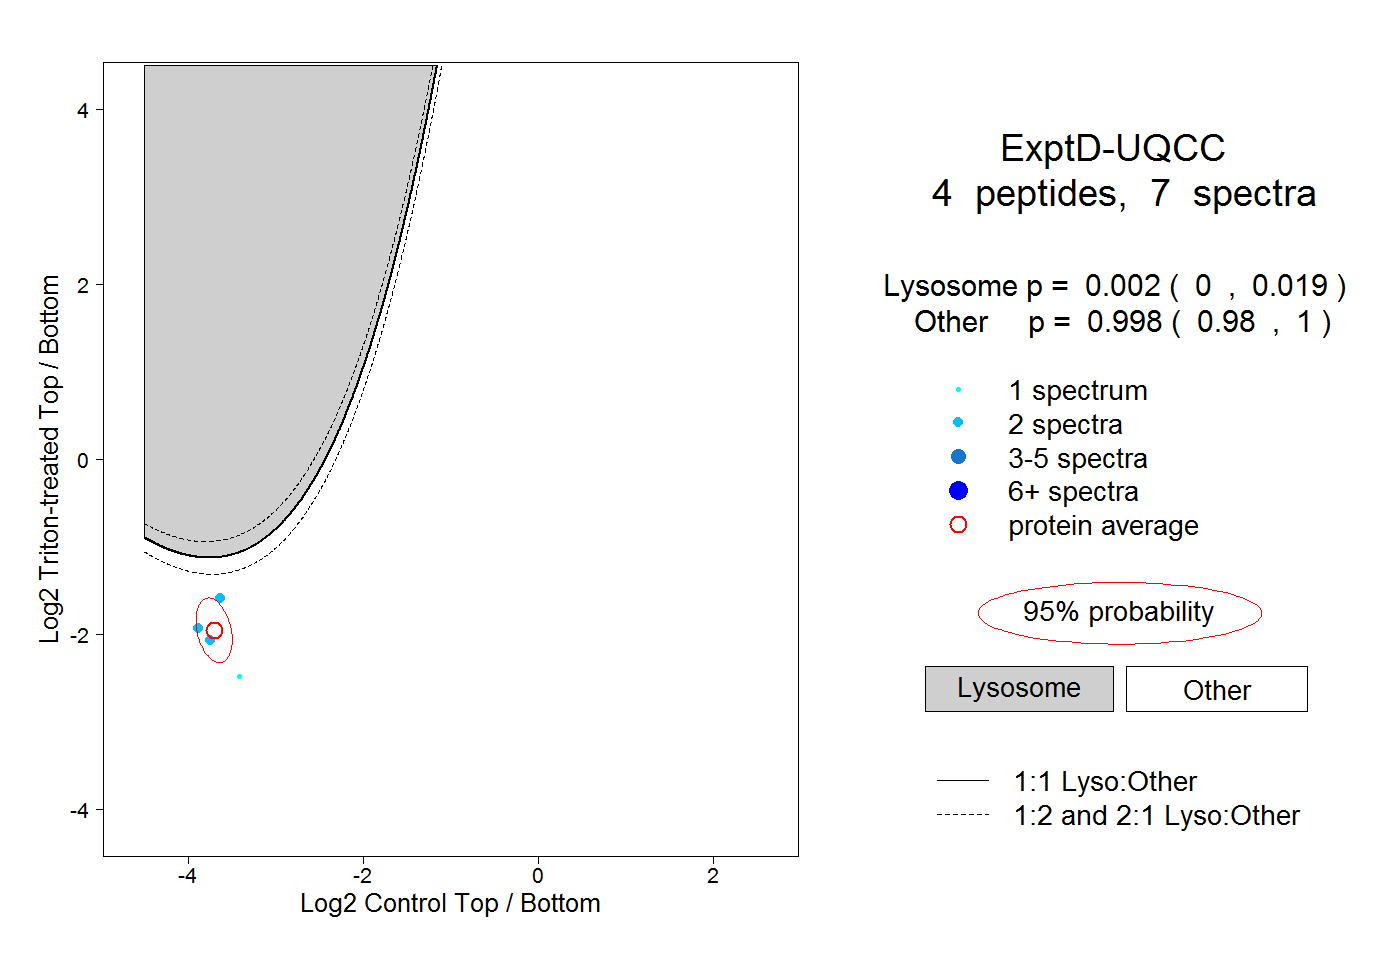
0.000 | 0.019
0.980 | 1.000