 6
6peptides
spectra
0.742 | 0.800
0.000 | 0.124
0.003 | 0.112
0.000 | 0.021
0.000 | 0.000
0.052 | 0.131
0.000 | 0.000
0.000 | 0.000
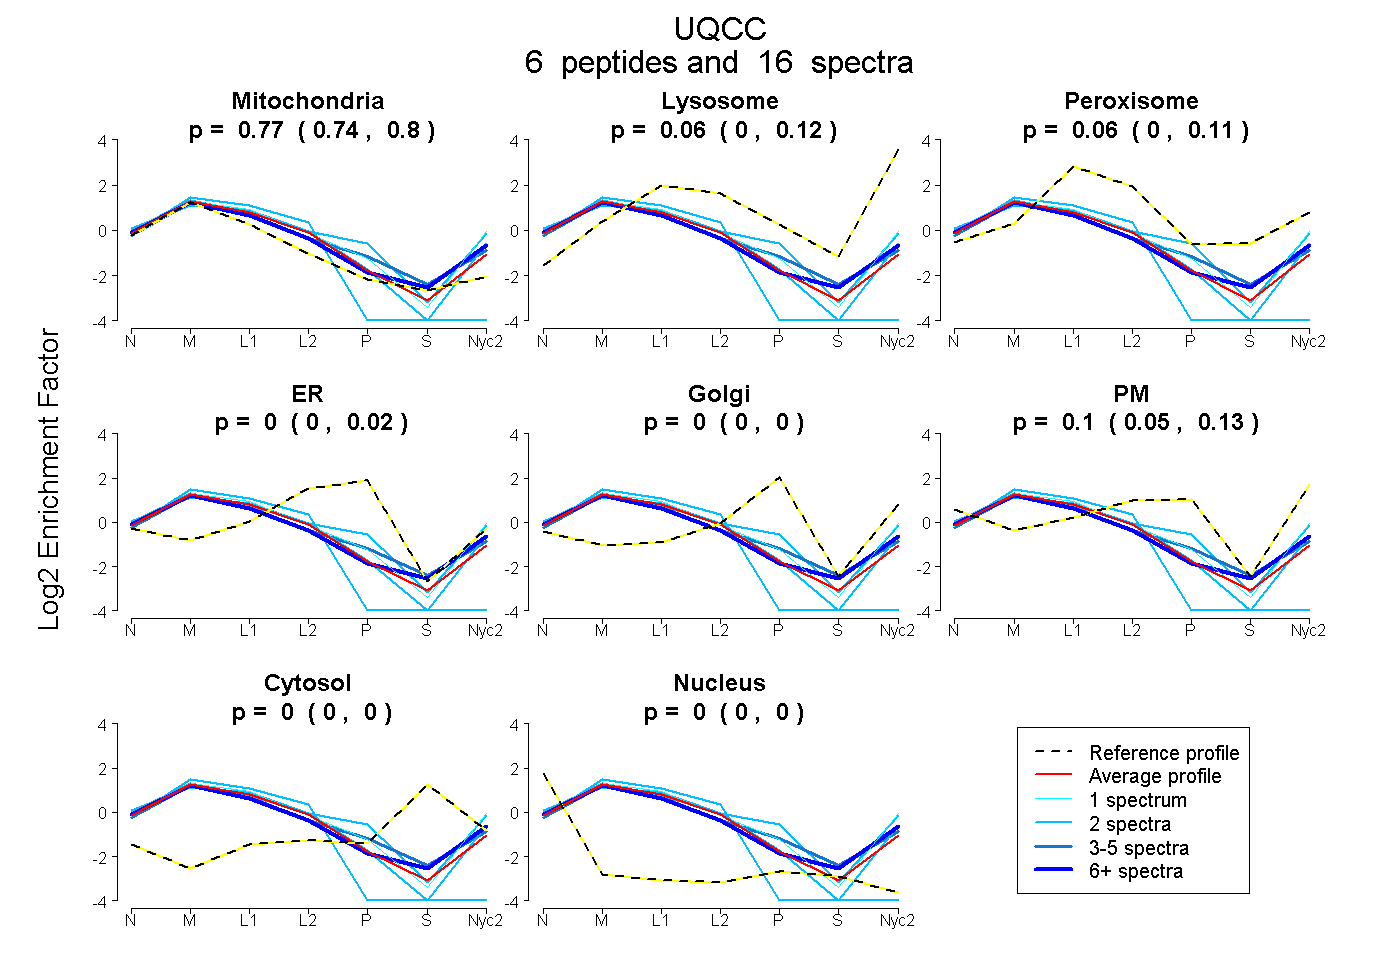
| Plot | Mito | Lyso | Perox | ER | Golgi | PM | Cytosol | Nucleus | |||||
| Expt A |
6 peptides |
16 spectra |
|
0.773 0.742 | 0.800 |
0.062 0.000 | 0.124 |
0.065 0.003 | 0.112 |
0.000 0.000 | 0.021 |
0.000 0.000 | 0.000 |
0.100 0.052 | 0.131 |
0.000 0.000 | 0.000 |
0.000 0.000 | 0.000 |
| 6 spectra, TDFEEFFLR | 0.773 | 0.179 | 0.002 | 0.000 | 0.000 | 0.045 | 0.000 | 0.000 | ||
| 2 spectra, DSPQPVEEK | 0.550 | 0.084 | 0.000 | 0.000 | 0.000 | 0.366 | 0.000 | 0.000 | ||
| 1 spectrum, VMGVNSYILK | 0.636 | 0.182 | 0.000 | 0.000 | 0.000 | 0.183 | 0.000 | 0.000 | ||
| 3 spectra, IIVHFMWEDVEQR | 0.713 | 0.113 | 0.047 | 0.028 | 0.000 | 0.099 | 0.000 | 0.000 | ||
| 2 spectra, QLELLVEYVR | 0.734 | 0.058 | 0.000 | 0.000 | 0.000 | 0.208 | 0.000 | 0.000 | ||
| 2 spectra, IIEAMGFTGPLK | 1.000 | 0.000 | 0.000 | 0.000 | 0.000 | 0.000 | 0.000 | 0.000 |
| Plot | Mito | Lyso or Perox | ER | Golgi | PM | Cytosol | Nucleus | ||||||
| Expt B |
3 peptides |
7 spectra |
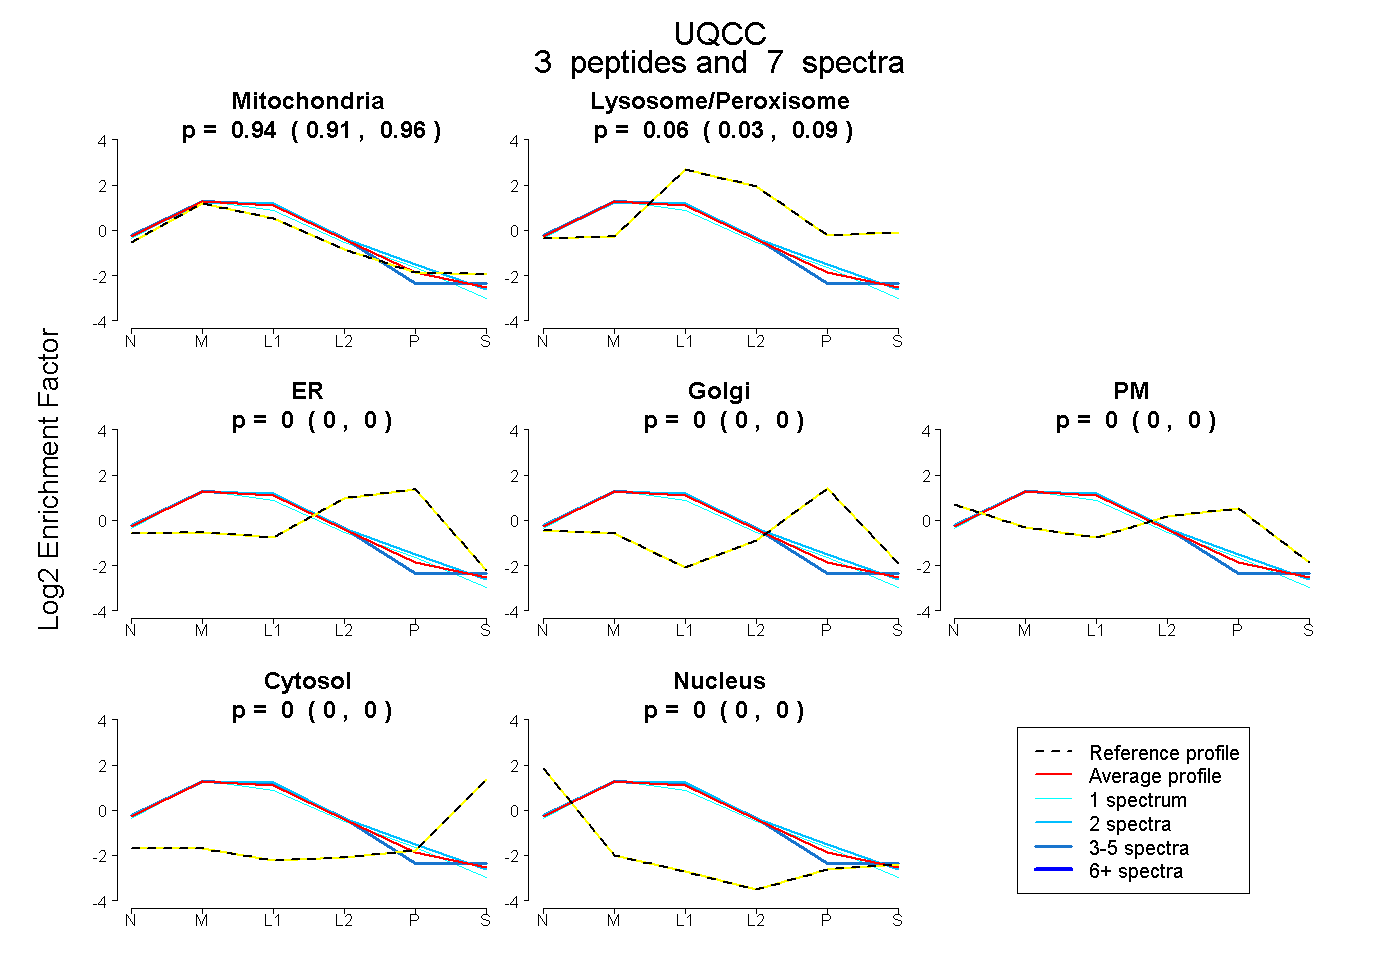 |
0.937 0.908 | 0.963 |
0.063 0.033 | 0.087 |
0.000 0.000 | 0.002 |
0.000 0.000 | 0.000 |
0.000 0.000 | 0.000 |
0.000 0.000 | 0.000 |
0.000 0.000 | 0.000 |
|||
| Plot | Lyso | Other | |||||||||||
| Expt C |
10 peptides |
83 spectra |
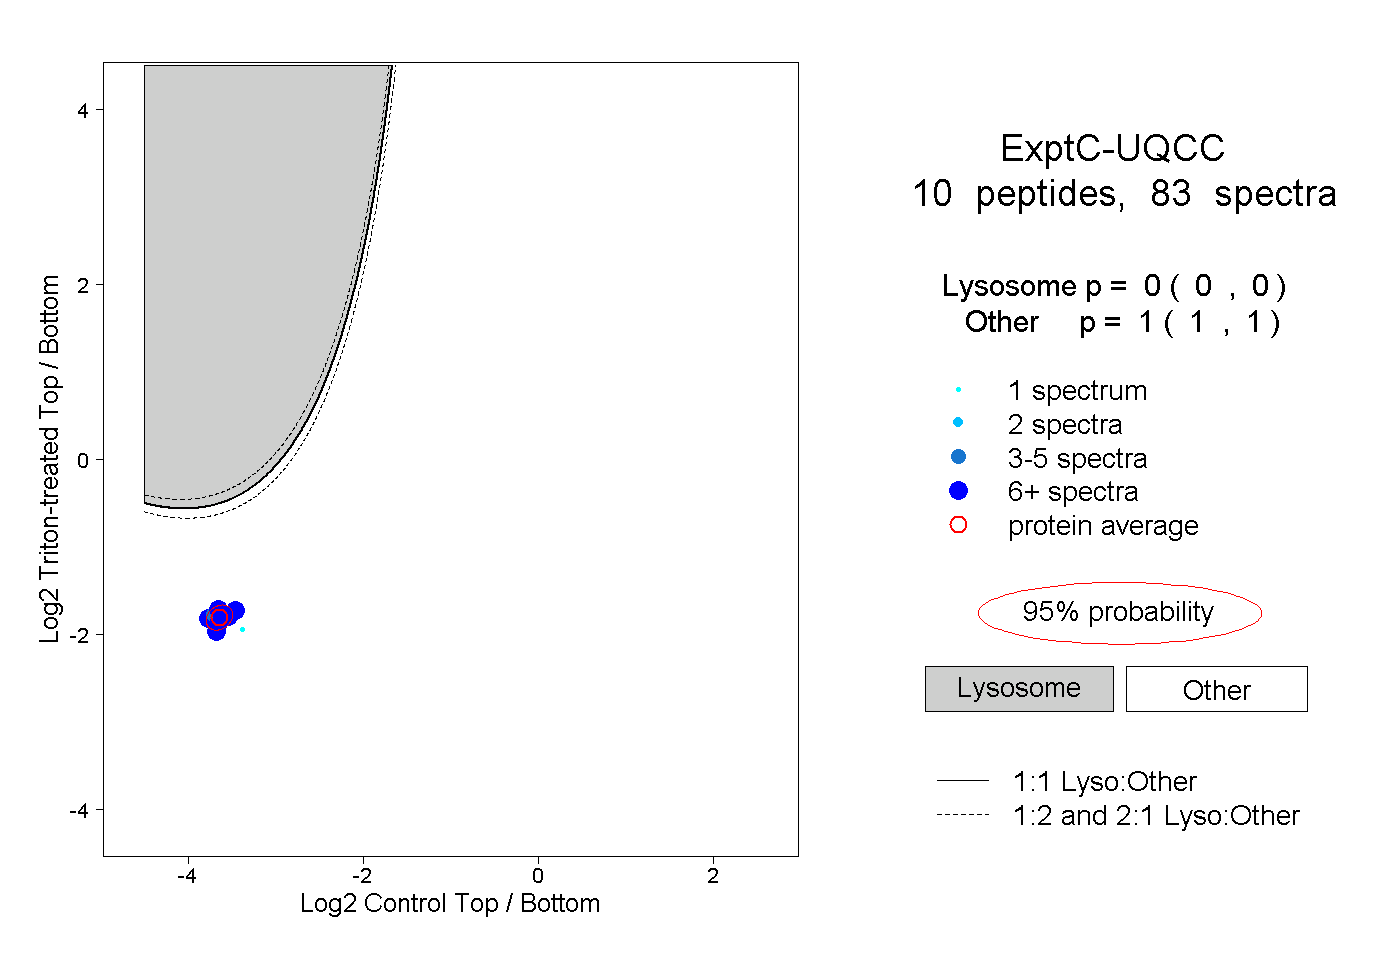 |
0.000 0.000 | 0.000 |
1.000 1.000 | 1.000 |
||||||||
| Plot | Lyso | Other | |||||||||||
| Expt D |
4 peptides |
7 spectra |
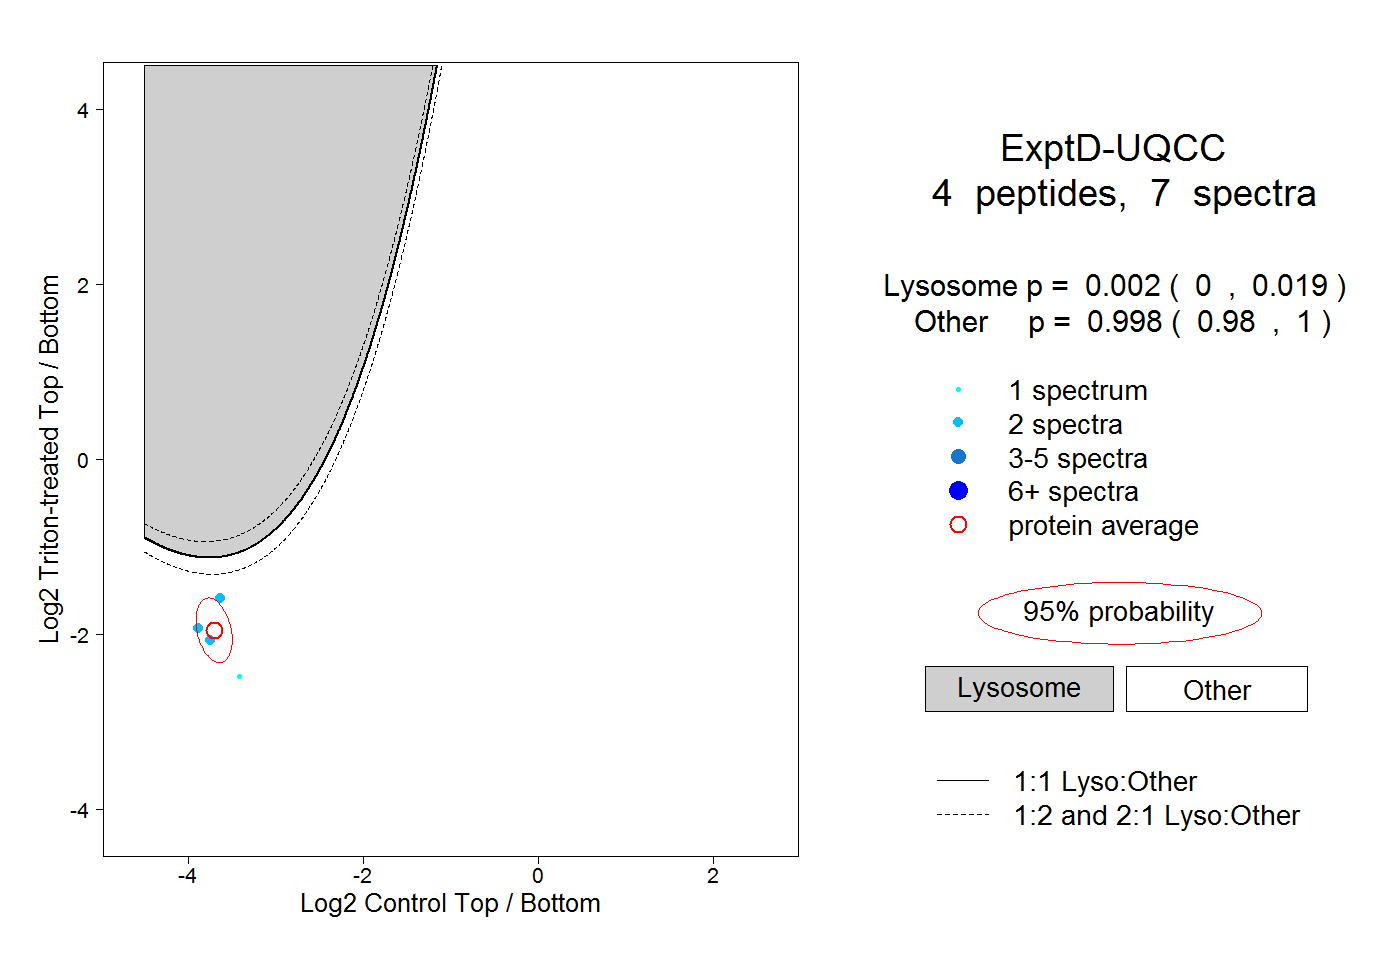 |
0.002 0.000 | 0.019 |
0.998 0.980 | 1.000 |