 22
22peptides
spectra
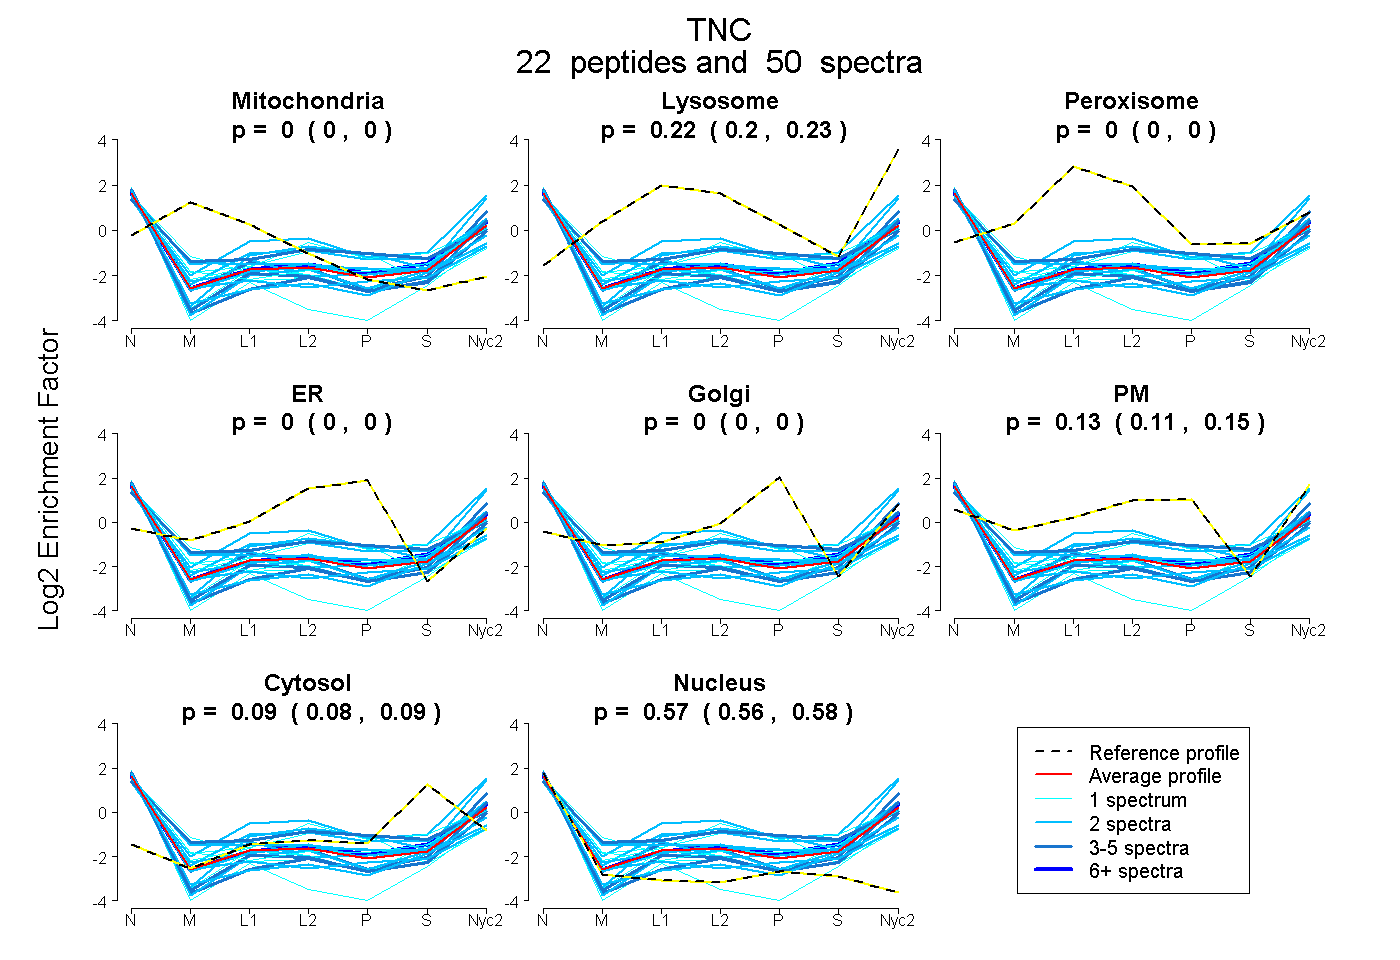
0.000 | 0.000
0.197 | 0.230
0.000 | 0.000
0.000 | 0.000
0.000 | 0.000
0.110 | 0.146
0.077 | 0.095
0.558 | 0.578
10peptides
spectra
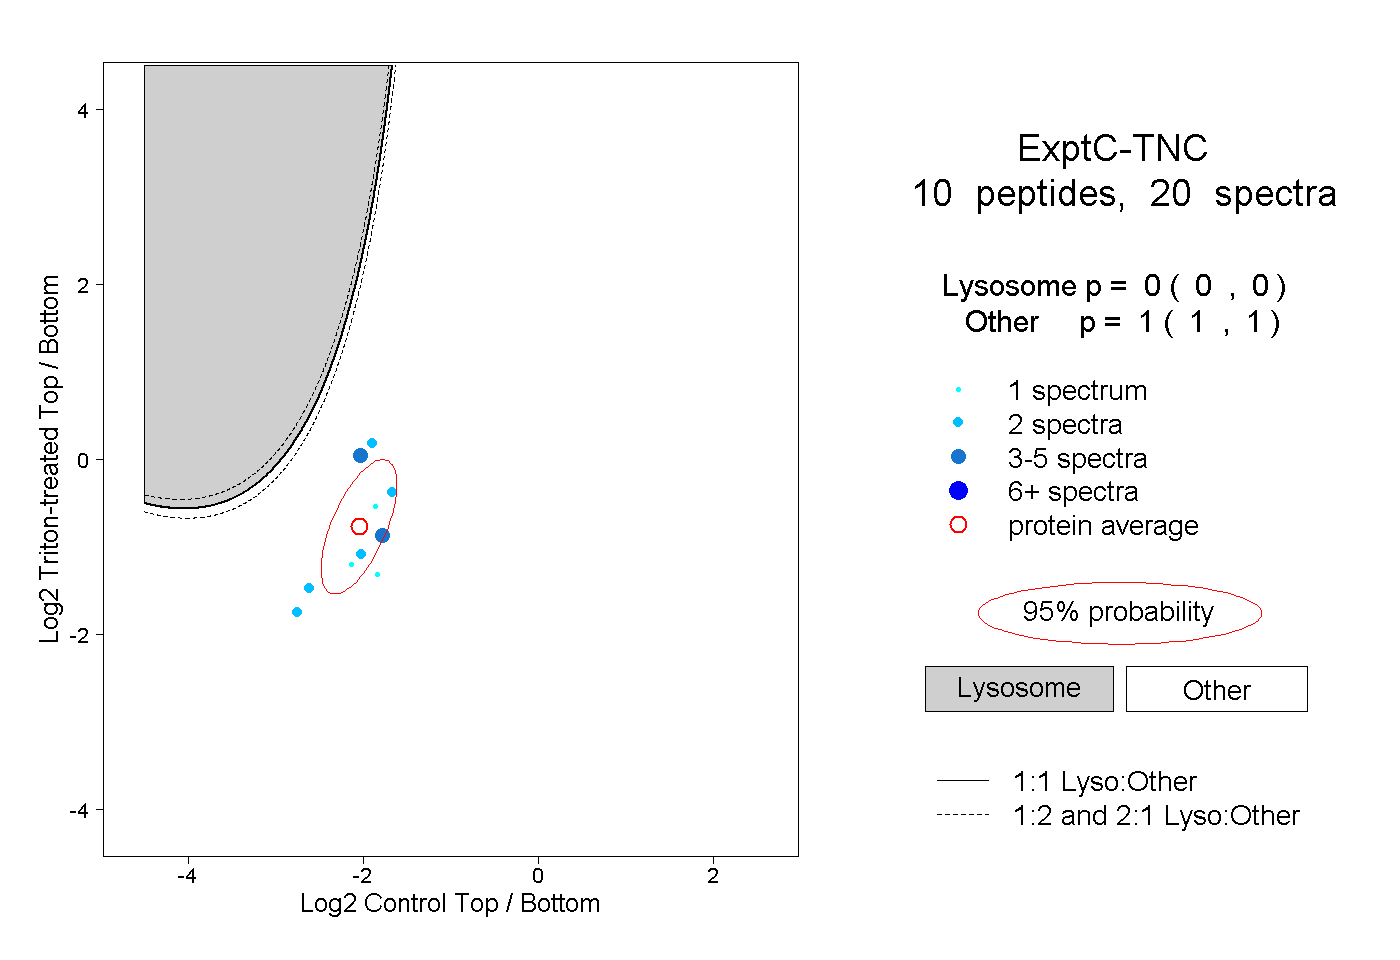
0.000 | 0.000
1.000 | 1.000
1peptide
spectrum
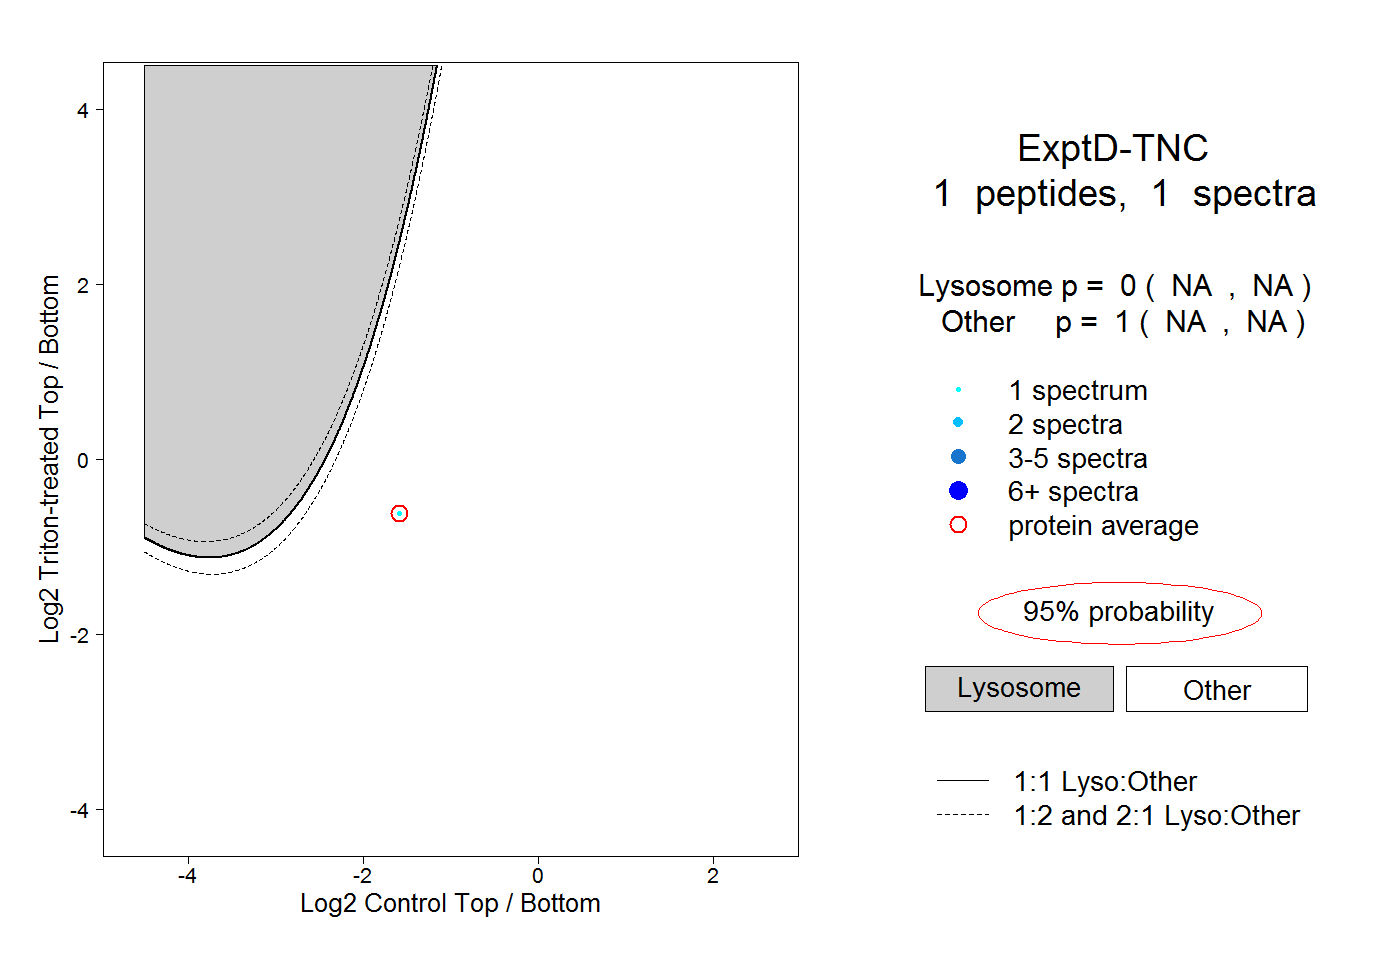
NA | NA
NA | NA