 22
22peptides
spectra
0.000 | 0.000
0.197 | 0.230
0.000 | 0.000
0.000 | 0.000
0.000 | 0.000
0.110 | 0.146
0.077 | 0.095
0.558 | 0.578
10peptides
spectra
0.000 | 0.000
1.000 | 1.000
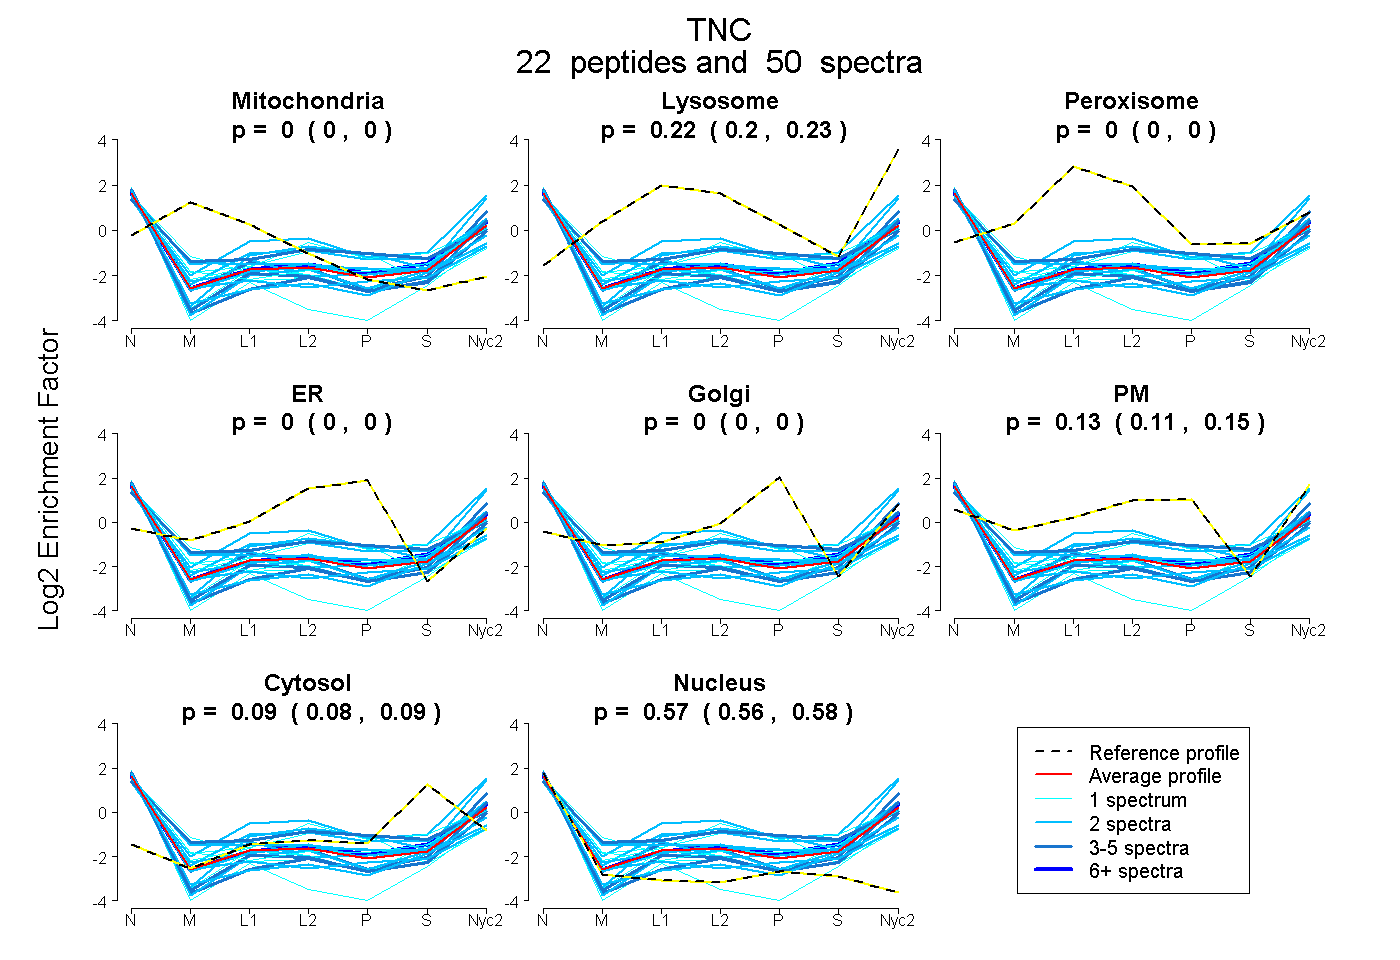
| Plot | Mito | Lyso | Perox | ER | Golgi | PM | Cytosol | Nucleus | |||||
| Expt A |
22 peptides |
50 spectra |
|
0.000 0.000 | 0.000 |
0.215 0.197 | 0.230 |
0.000 0.000 | 0.000 |
0.000 0.000 | 0.000 |
0.000 0.000 | 0.000 |
0.129 0.110 | 0.146 |
0.087 0.077 | 0.095 |
0.569 0.558 | 0.578 |
||
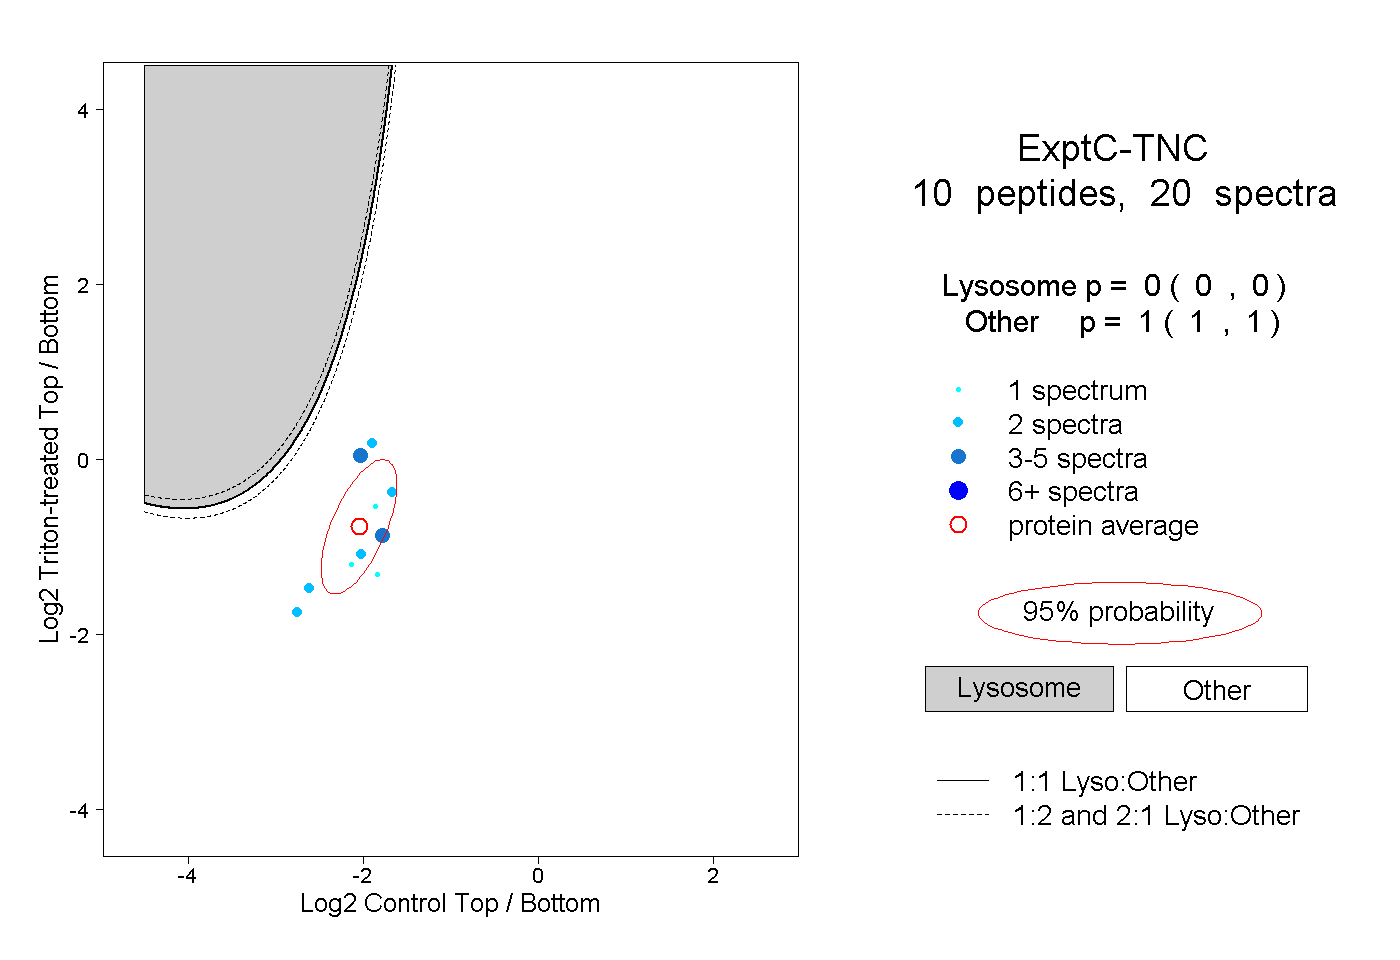
| Plot | Lyso | Other | |||||||||||
| Expt C |
10 peptides |
20 spectra |
|
0.000 0.000 | 0.000 |
1.000 1.000 | 1.000 |
| 1 spectrum, RPETSYR | 0.000 | 1.000 | ||||||||
| 4 spectra, APTAQVESFR | 0.000 | 1.000 | ||||||||
| 2 spectra, VPGDQTSTTIR | 0.000 | 1.000 | ||||||||
| 2 spectra, SQQATTK | 0.000 | 1.000 | ||||||||
| 1 spectrum, IQALSGSLR | 0.000 | 1.000 | ||||||||
| 2 spectra, LDAPSQIEVR | 0.000 | 1.000 | ||||||||
| 1 spectrum, VPEITR | 0.000 | 1.000 | ||||||||
| 3 spectra, ADIDSYR | 0.000 | 1.000 | ||||||||
| 2 spectra, VSIYGVAR | 0.000 | 1.000 | ||||||||
| 2 spectra, ETFITGLDAPR | 0.000 | 1.000 |
| Plot | Lyso | Other | |||||||||||
| Expt D |
1 peptide |
1 spectrum |
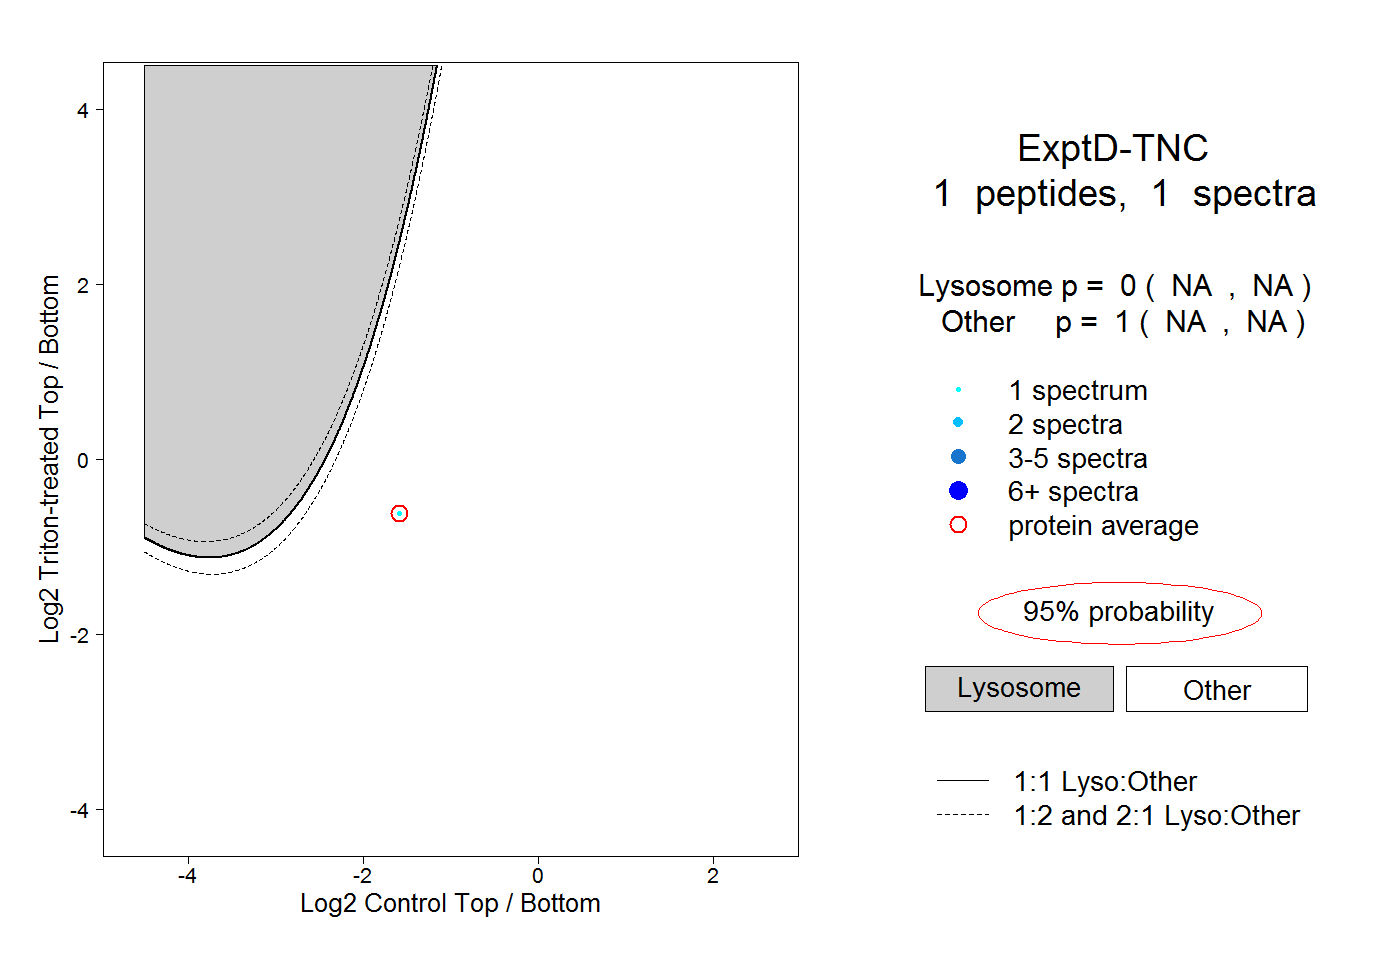 |
0.000 NA | NA |
1.000 NA | NA |