 6
6peptides
spectra
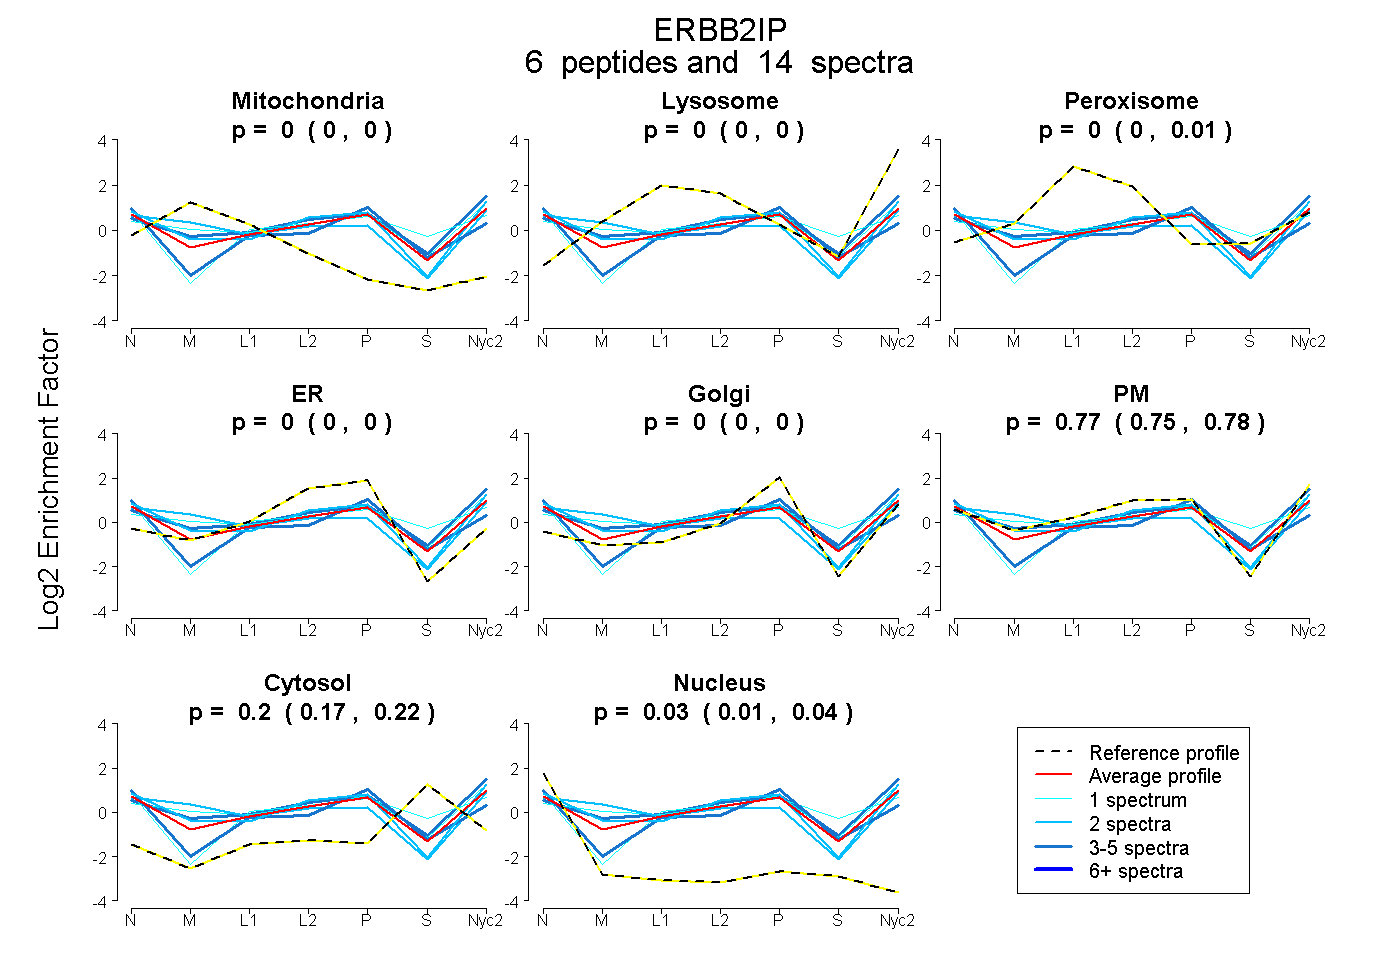
0.000 | 0.000
0.000 | 0.000
0.000 | 0.012
0.000 | 0.000
0.000 | 0.000
0.749 | 0.783
0.173 | 0.224
0.012 | 0.044
8peptides
spectra
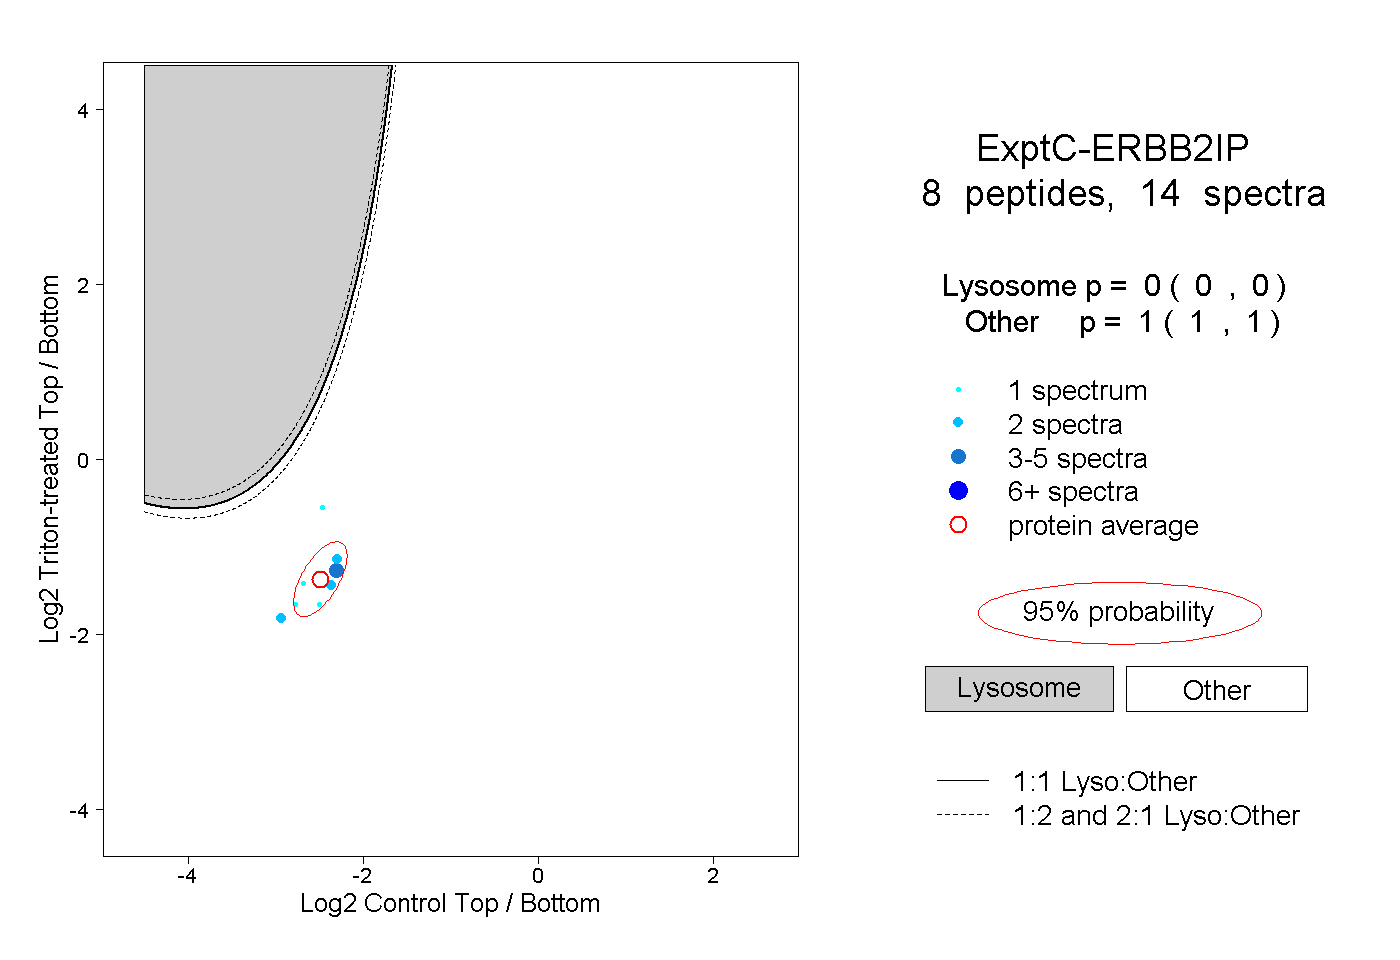
0.000 | 0.000
1.000 | 1.000
1peptide
spectrum
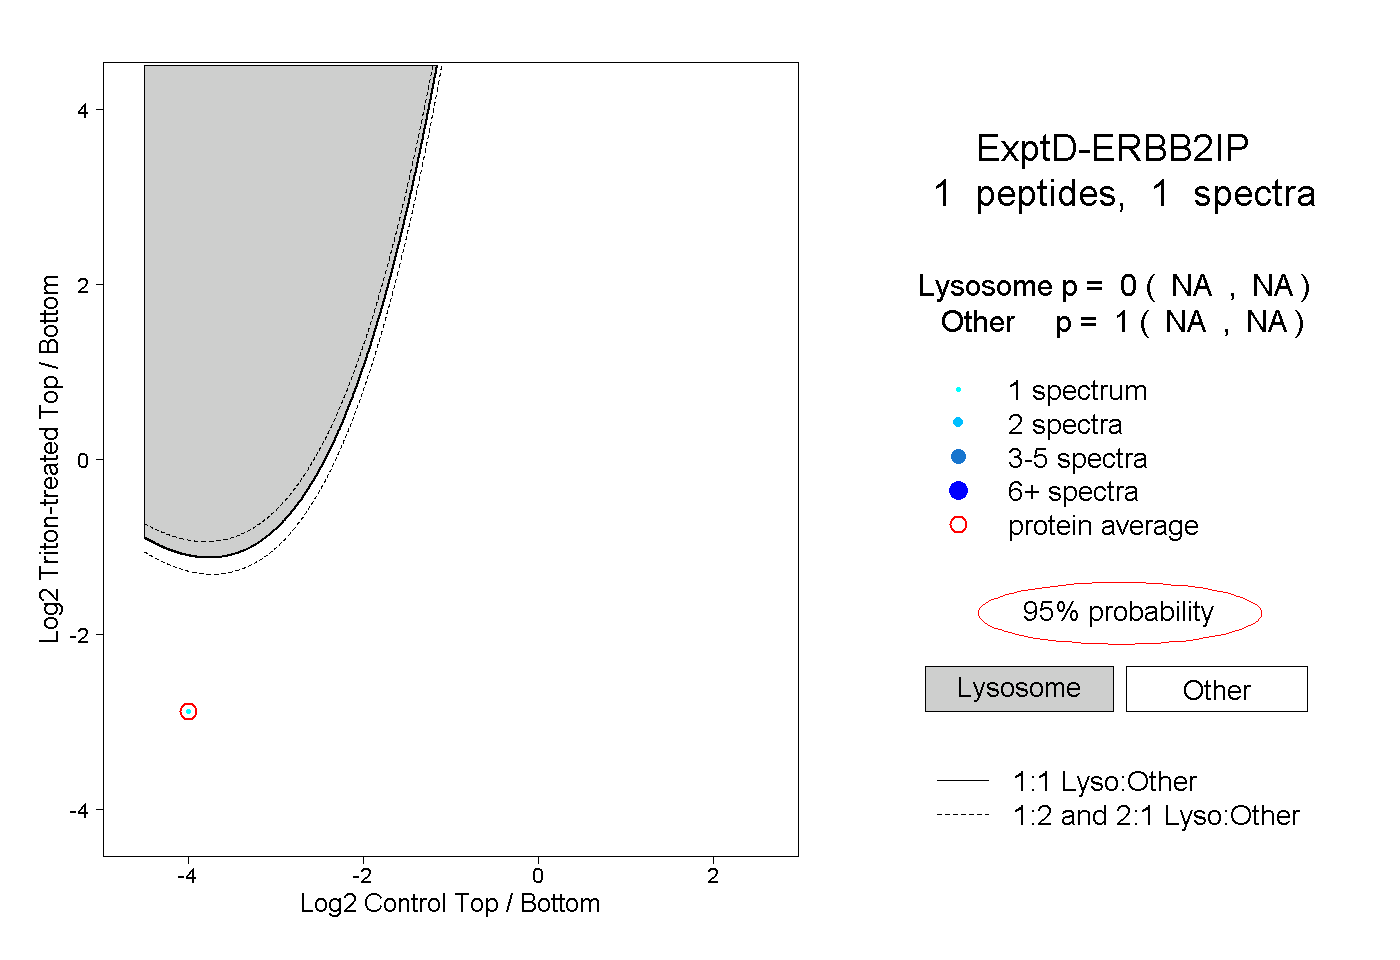
NA | NA
NA | NA