 6
6peptides
spectra
0.000 | 0.000
0.000 | 0.000
0.000 | 0.012
0.000 | 0.000
0.000 | 0.000
0.749 | 0.783
0.173 | 0.224
0.012 | 0.044
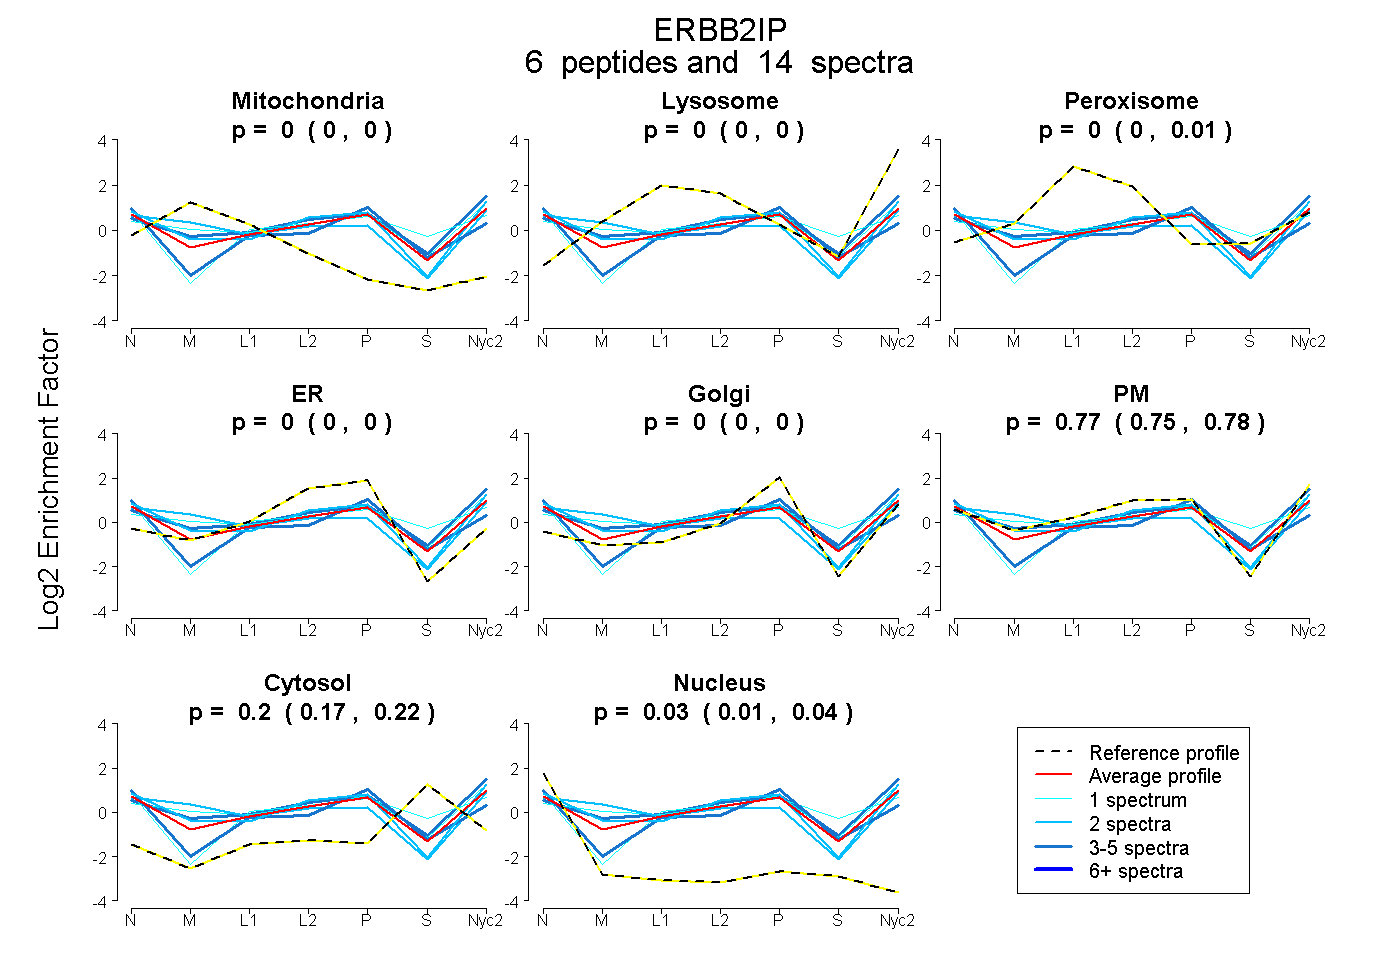
| Plot | Mito | Lyso | Perox | ER | Golgi | PM | Cytosol | Nucleus | |||||
| Expt A |
6 peptides |
14 spectra |
|
0.000 0.000 | 0.000 |
0.000 0.000 | 0.000 |
0.000 0.000 | 0.012 |
0.000 0.000 | 0.000 |
0.000 0.000 | 0.000 |
0.769 0.749 | 0.783 |
0.202 0.173 | 0.224 |
0.028 0.012 | 0.044 |
| 1 spectrum, EQLIDYLMLK | 0.000 | 0.000 | 0.000 | 0.000 | 0.000 | 0.594 | 0.406 | 0.000 | ||
| 2 spectra, VLNLSDNR | 0.000 | 0.000 | 0.000 | 0.000 | 0.000 | 0.882 | 0.049 | 0.069 | ||
| 5 spectra, EFWMDGNR | 0.000 | 0.064 | 0.009 | 0.000 | 0.000 | 0.741 | 0.186 | 0.000 | ||
| 2 spectra, NLPFSFTK | 0.229 | 0.000 | 0.000 | 0.000 | 0.000 | 0.731 | 0.020 | 0.020 | ||
| 3 spectra, TPVTSGSQRPLSAR | 0.000 | 0.000 | 0.000 | 0.066 | 0.154 | 0.470 | 0.210 | 0.100 | ||
| 1 spectrum, LETLPEEMGDMQK | 0.050 | 0.068 | 0.000 | 0.000 | 0.000 | 0.708 | 0.174 | 0.000 |
| Plot | Lyso | Other | |||||||||||
| Expt C |
8 peptides |
14 spectra |
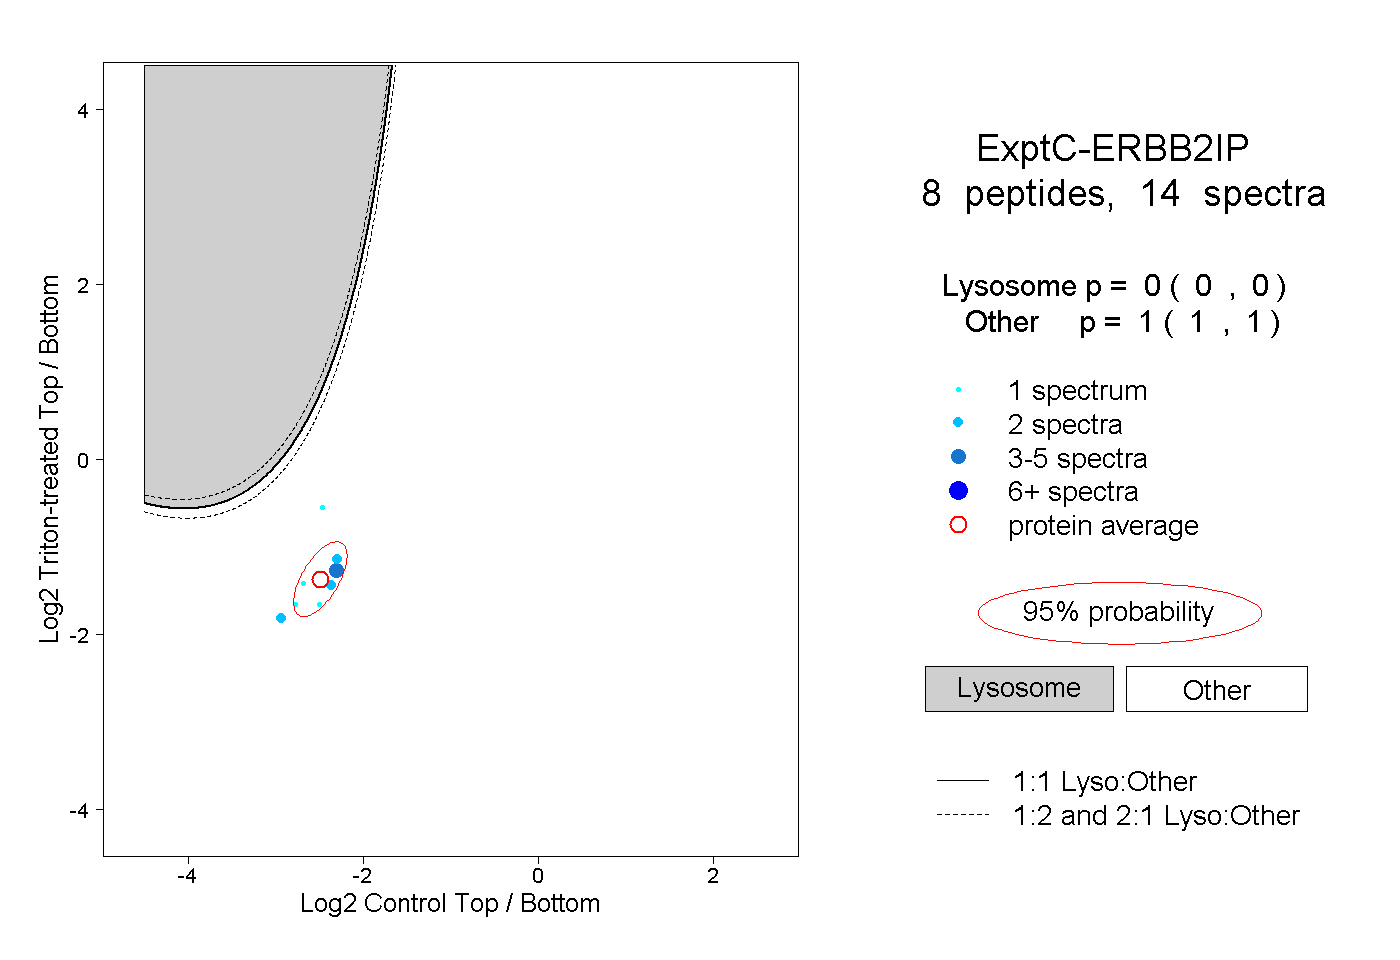 |
0.000 0.000 | 0.000 |
1.000 1.000 | 1.000 |
||||||||
| Plot | Lyso | Other | |||||||||||
| Expt D |
1 peptide |
1 spectrum |
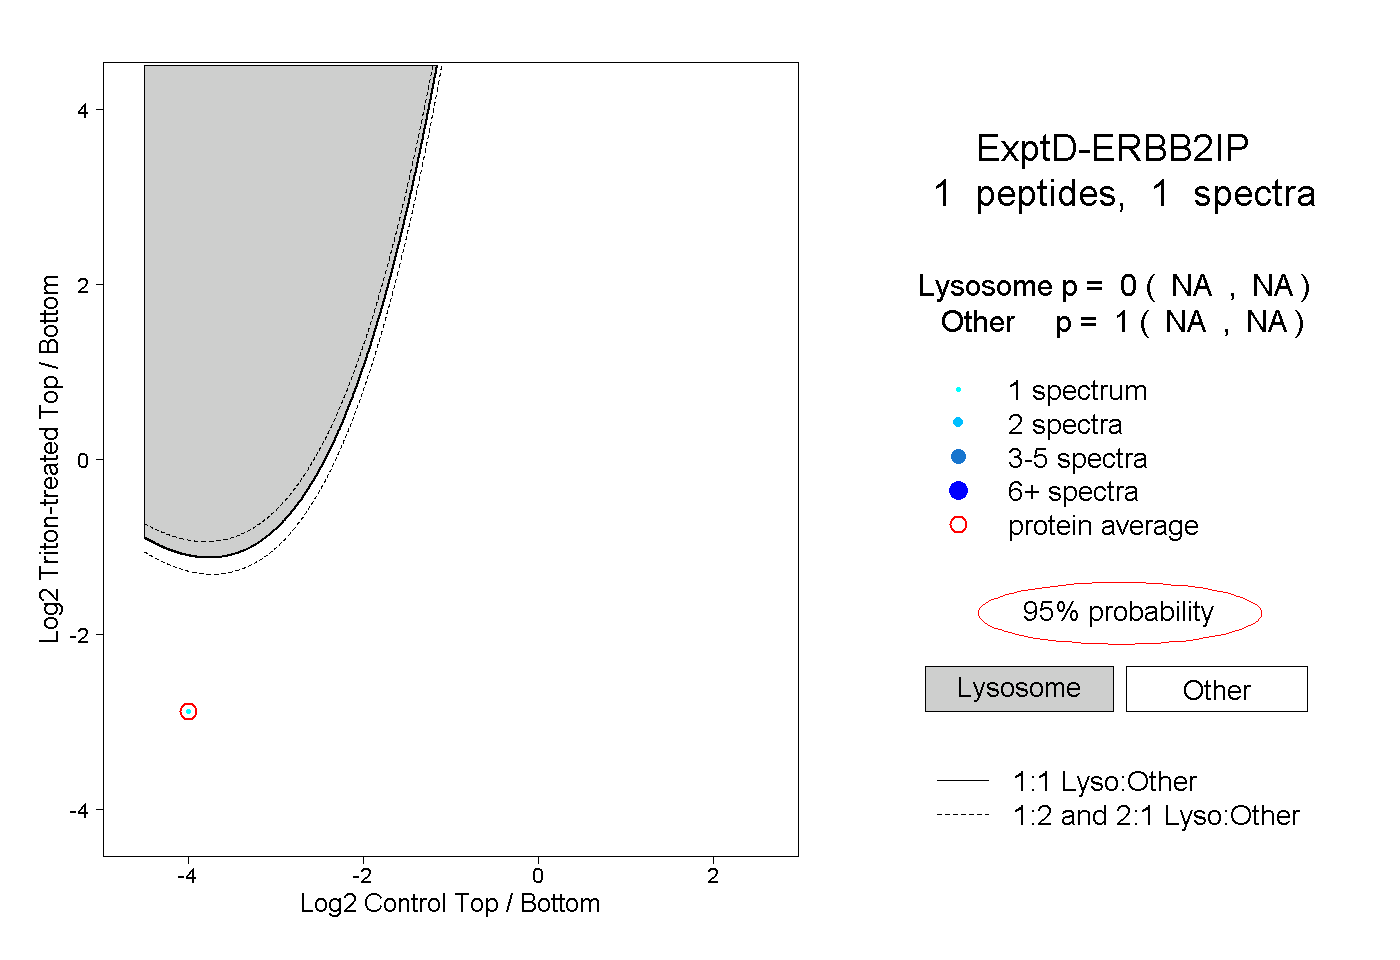 |
0.000 NA | NA |
1.000 NA | NA |