 4
4peptides
spectra
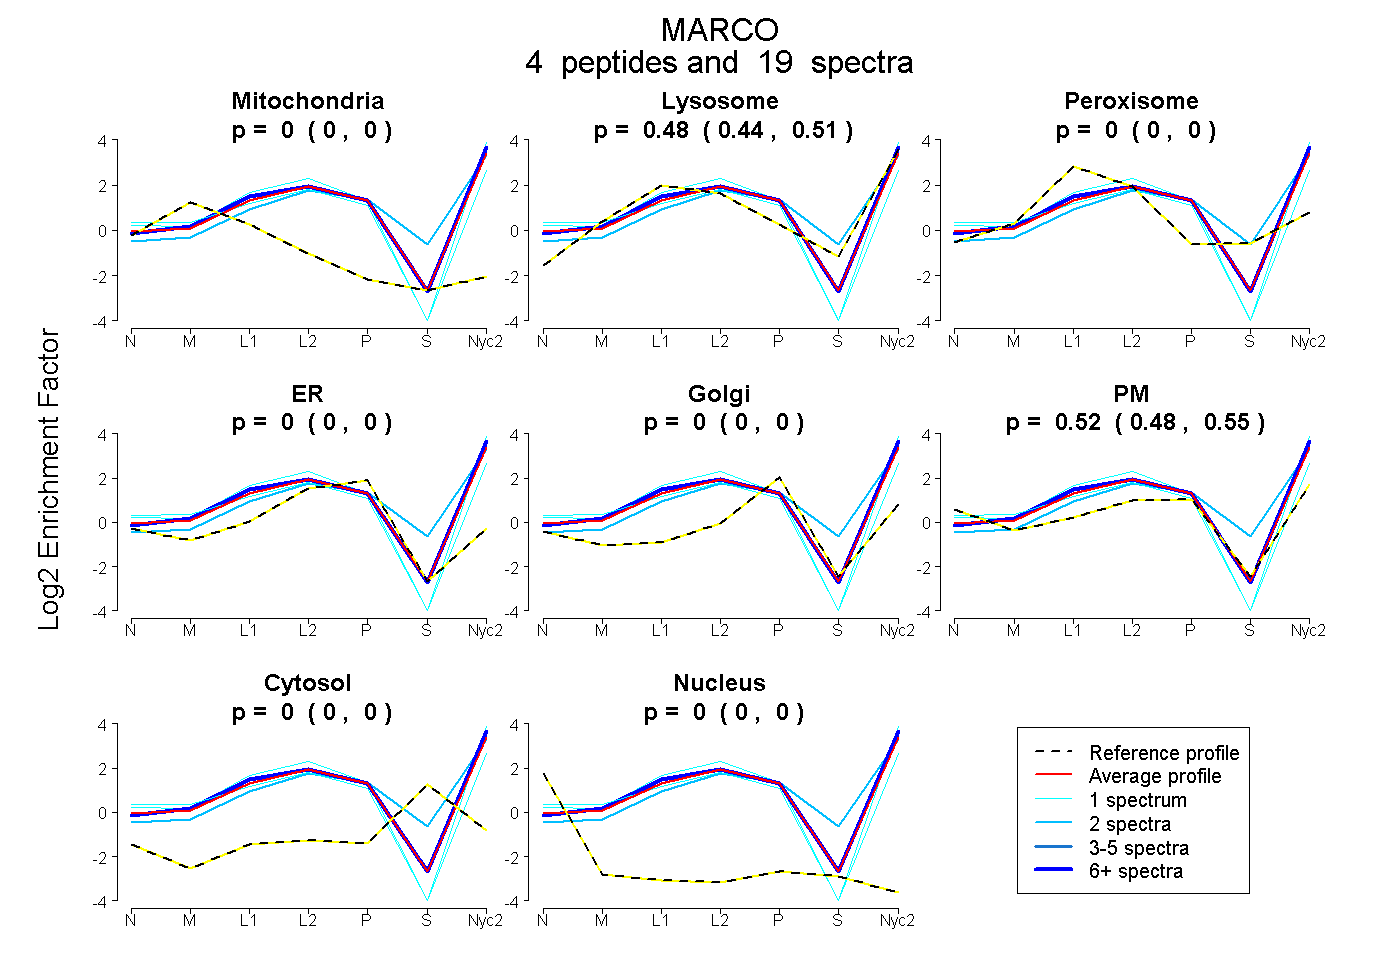
0.000 | 0.000
0.443 | 0.511
0.000 | 0.000
0.000 | 0.000
0.000 | 0.000
0.483 | 0.549
0.000 | 0.000
0.000 | 0.000
2peptides
spectra
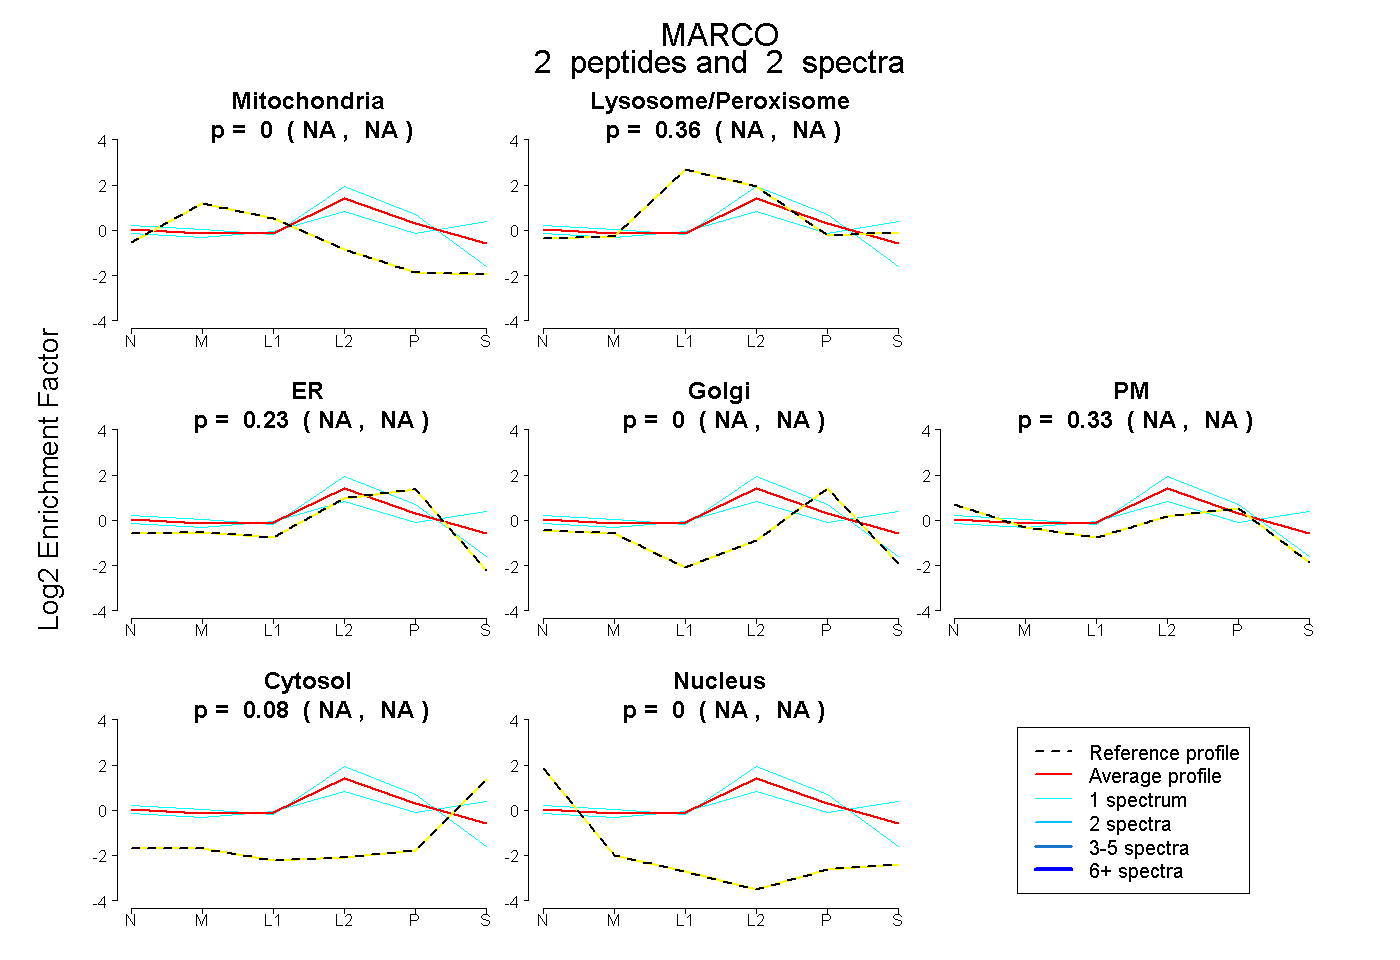
NA | NA
NA | NA
NA | NA
NA | NA
NA | NA
NA | NA
NA | NA
5peptides
spectra
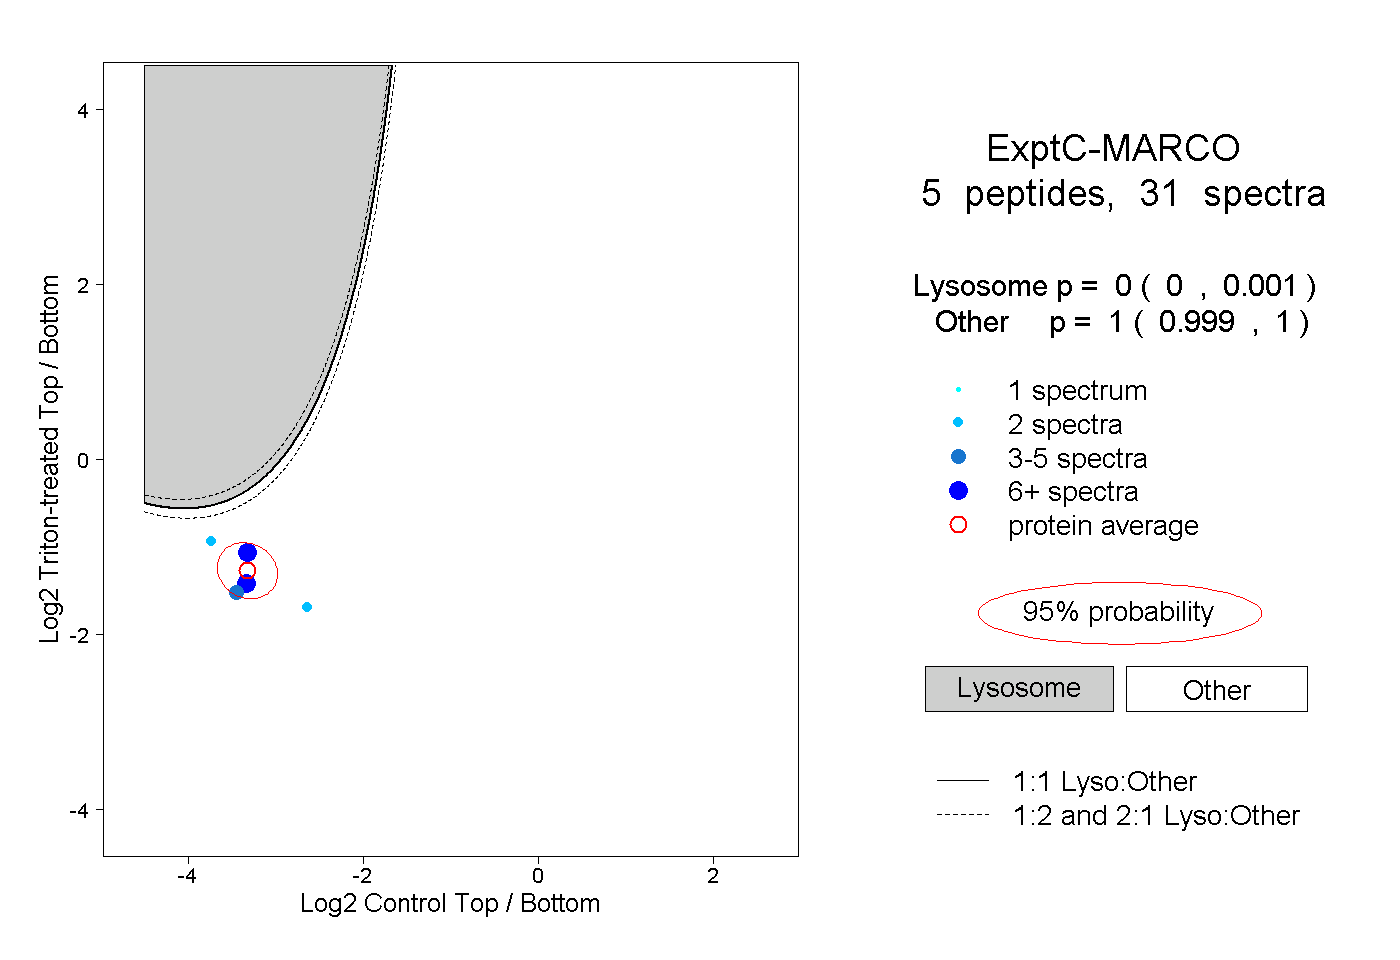
0.000 | 0.001
0.999 | 1.000
3peptides
spectra
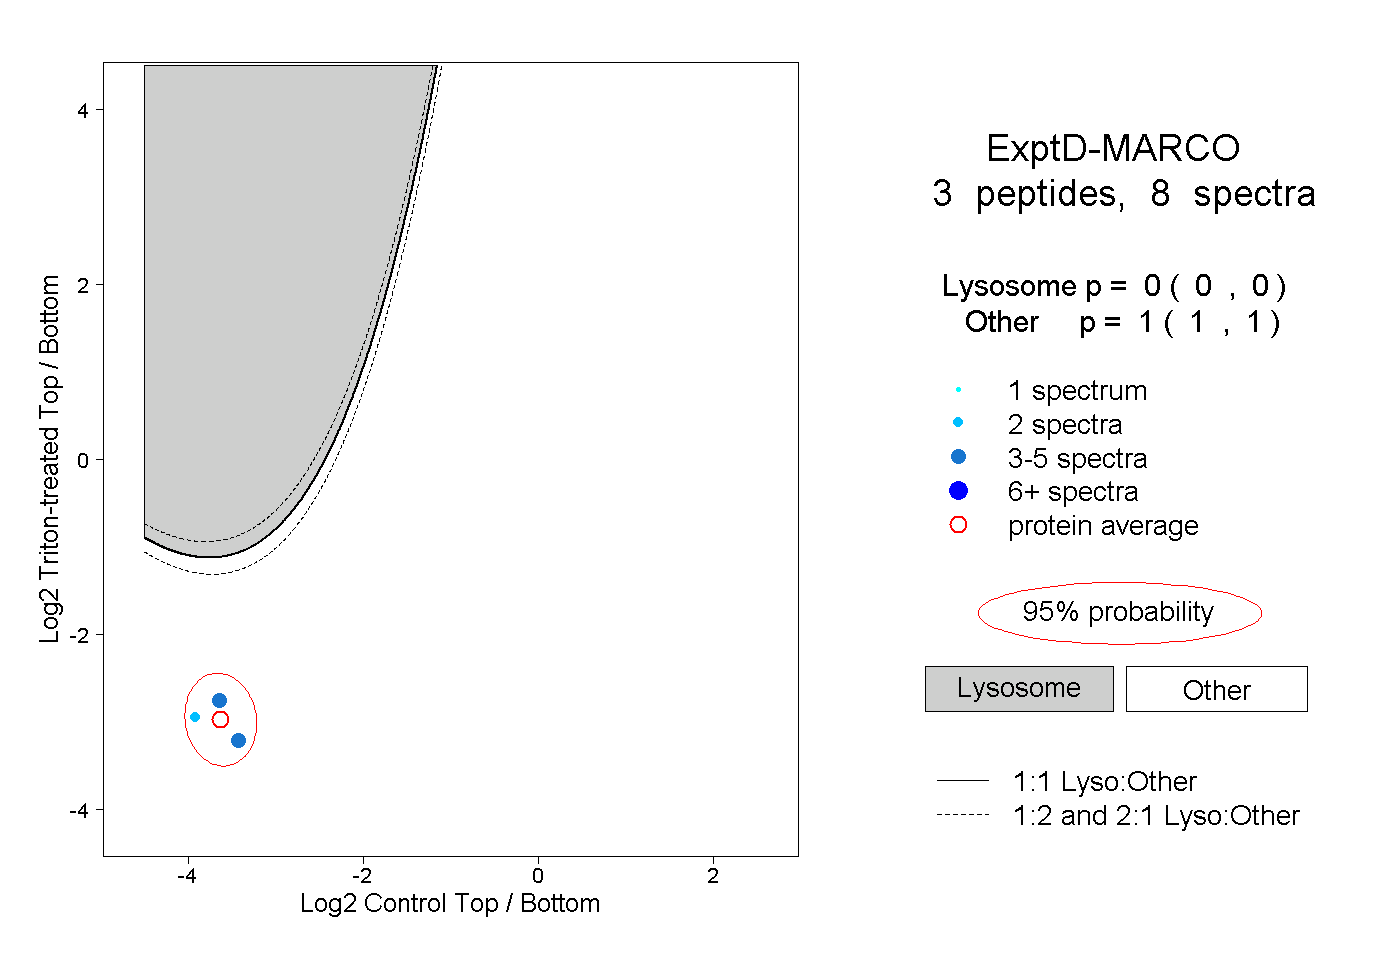
0.000 | 0.000
1.000 | 1.000