 4
4peptides
spectra
0.000 | 0.000
0.443 | 0.511
0.000 | 0.000
0.000 | 0.000
0.000 | 0.000
0.483 | 0.549
0.000 | 0.000
0.000 | 0.000
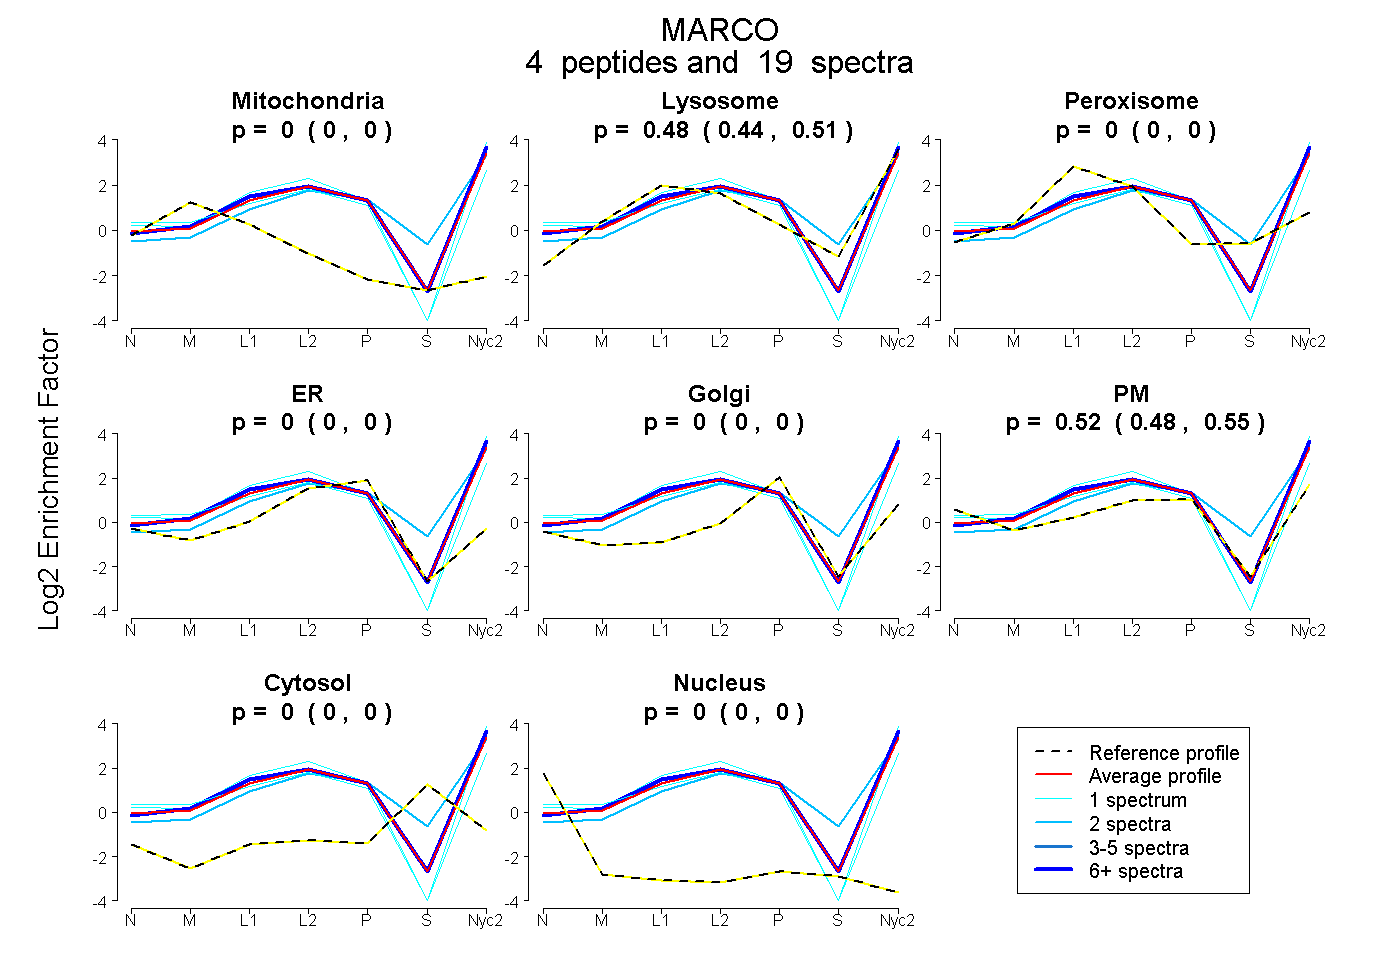
| Plot | Mito | Lyso | Perox | ER | Golgi | PM | Cytosol | Nucleus | |||||
| Expt A |
4 peptides |
19 spectra |
|
0.000 0.000 | 0.000 |
0.481 0.443 | 0.511 |
0.000 0.000 | 0.000 |
0.000 0.000 | 0.000 |
0.000 0.000 | 0.000 |
0.519 0.483 | 0.549 |
0.000 0.000 | 0.000 |
0.000 0.000 | 0.000 |
| 1 spectrum, QQVDNLTQNPELFR | 0.000 | 0.210 | 0.000 | 0.000 | 0.000 | 0.790 | 0.000 | 0.000 | ||
| 2 spectra, IVGGTSR | 0.000 | 0.666 | 0.000 | 0.000 | 0.105 | 0.228 | 0.001 | 0.000 | ||
| 1 spectrum, GLGSFGGGTGK | 0.000 | 0.448 | 0.000 | 0.000 | 0.000 | 0.552 | 0.000 | 0.000 | ||
| 15 spectra, MLGYSSGR | 0.000 | 0.551 | 0.000 | 0.000 | 0.000 | 0.449 | 0.000 | 0.000 |
| Plot | Mito | Lyso or Perox | ER | Golgi | PM | Cytosol | Nucleus | ||||||
| Expt B |
2 peptides |
2 spectra |
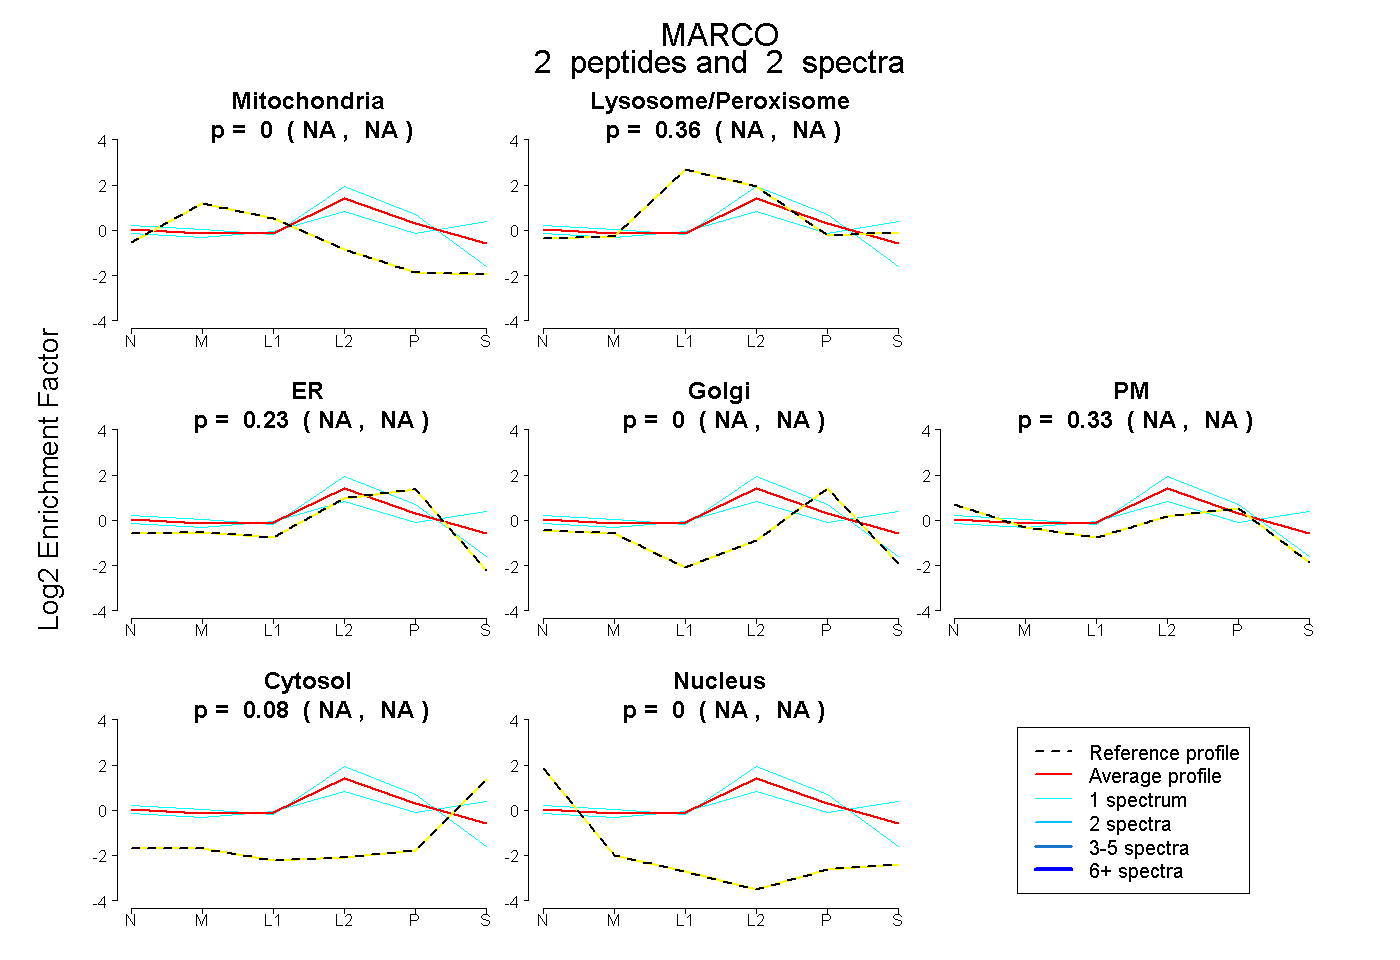 |
0.000 NA | NA |
0.359 NA | NA |
0.231 NA | NA |
0.000 NA | NA |
0.332 NA | NA |
0.078 NA | NA |
0.000 NA | NA |
|||
| Plot | Lyso | Other | |||||||||||
| Expt C |
5 peptides |
31 spectra |
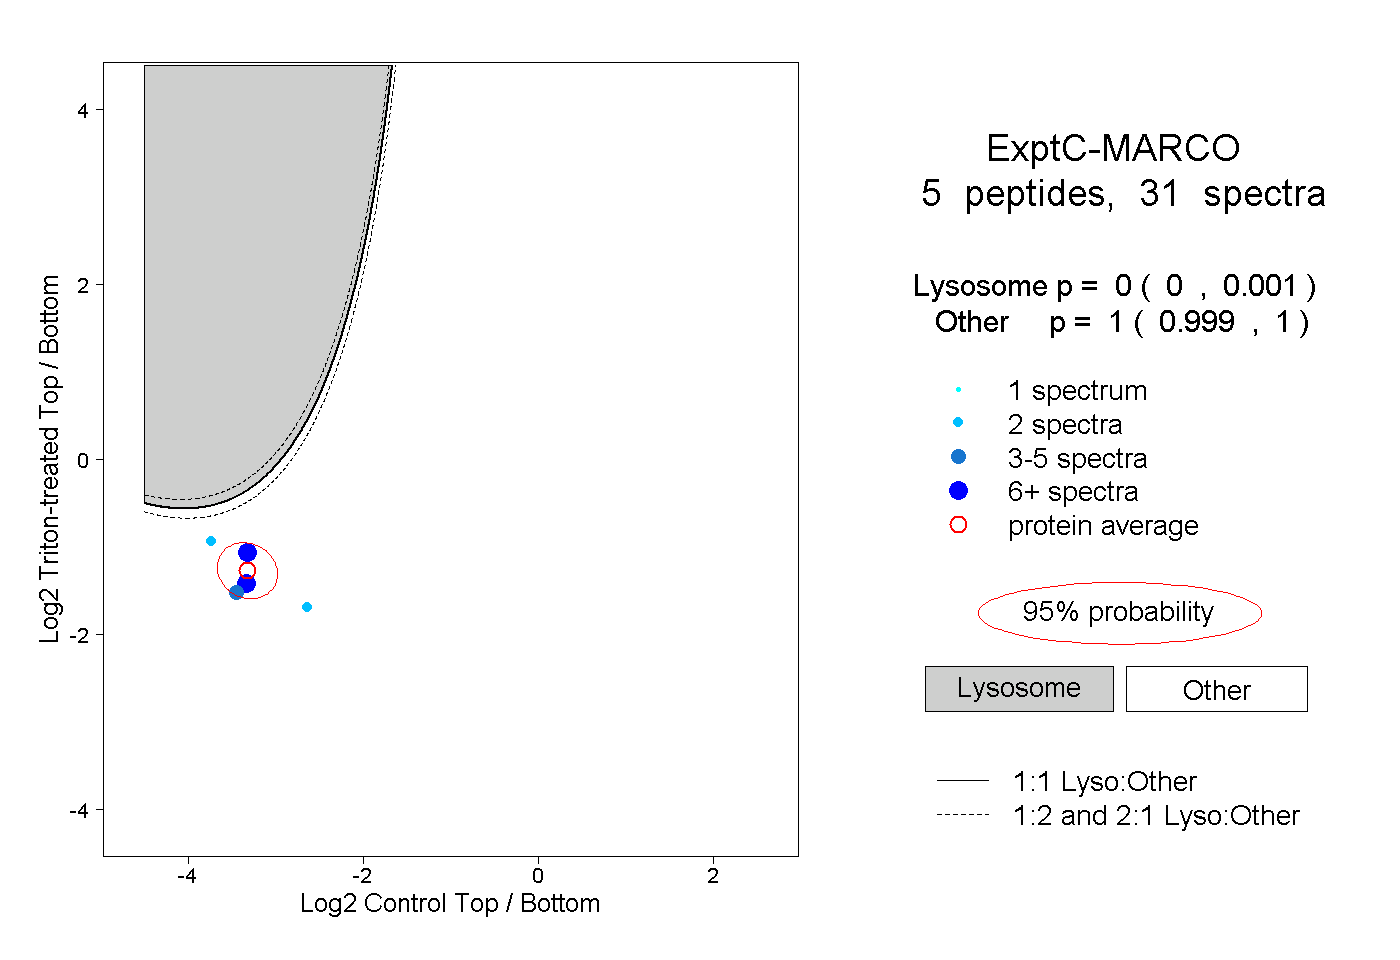 |
0.000 0.000 | 0.001 |
1.000 0.999 | 1.000 |
||||||||
| Plot | Lyso | Other | |||||||||||
| Expt D |
3 peptides |
8 spectra |
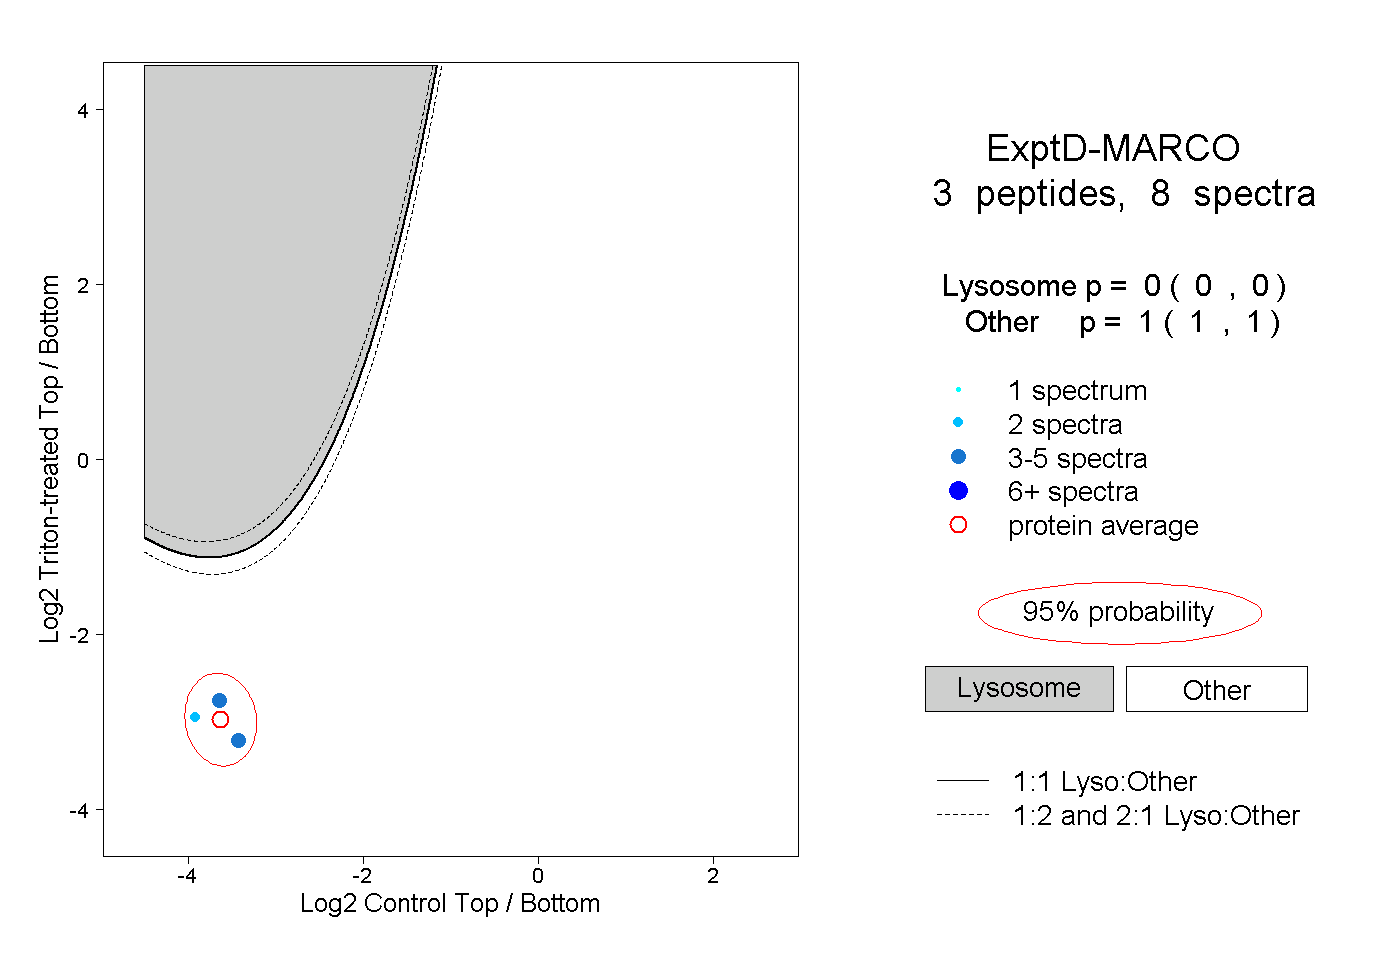 |
0.000 0.000 | 0.000 |
1.000 1.000 | 1.000 |