 5
5peptides
spectra
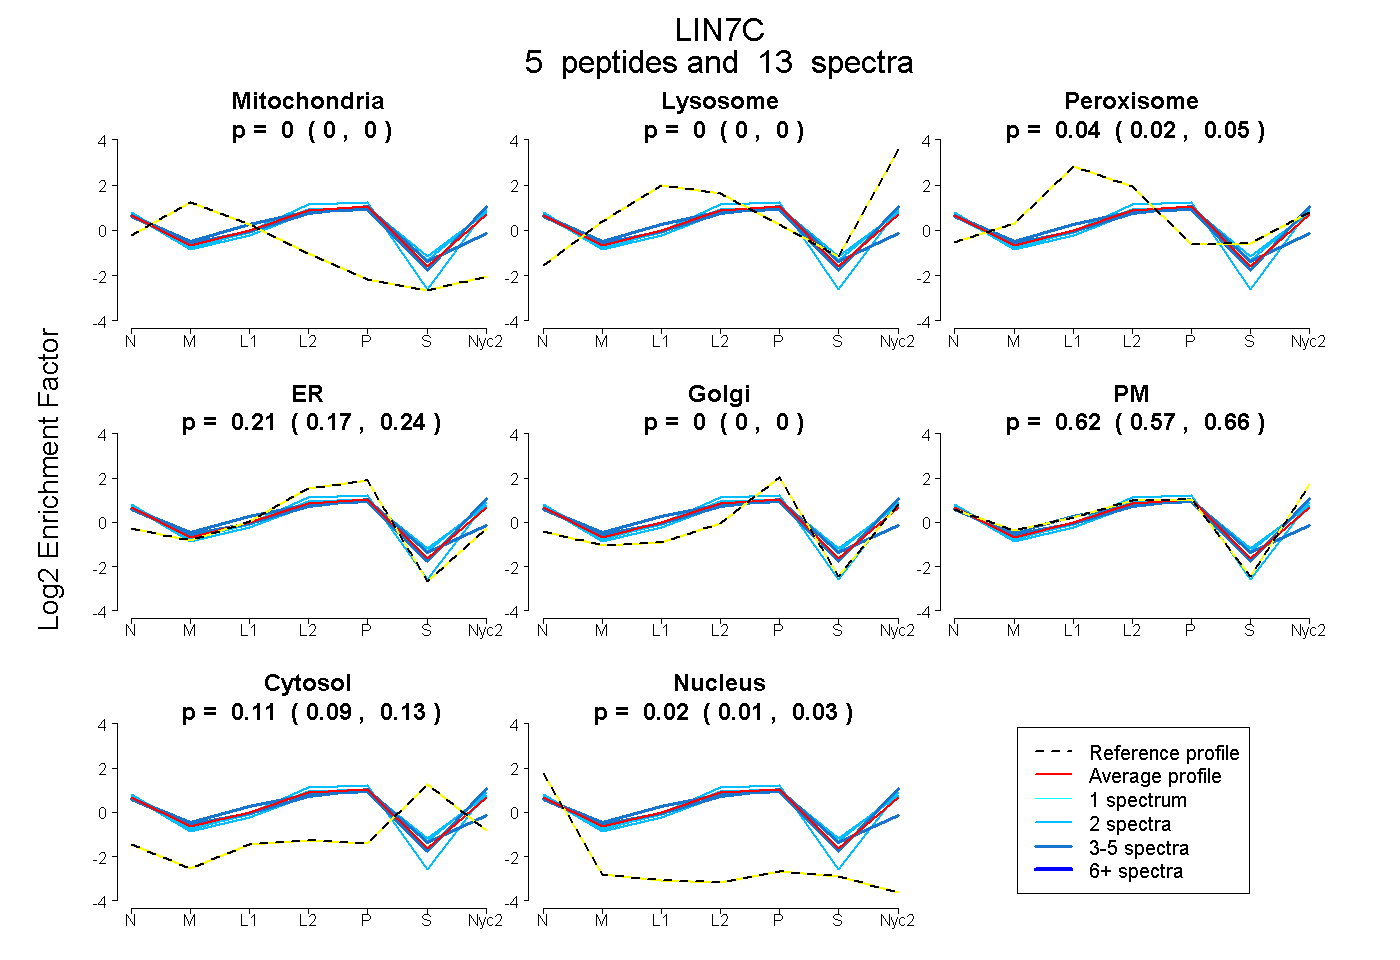
0.000 | 0.000
0.000 | 0.000
0.021 | 0.050
0.168 | 0.239
0.000 | 0.000
0.568 | 0.661
0.091 | 0.132
0.007 | 0.034
4peptides
spectra
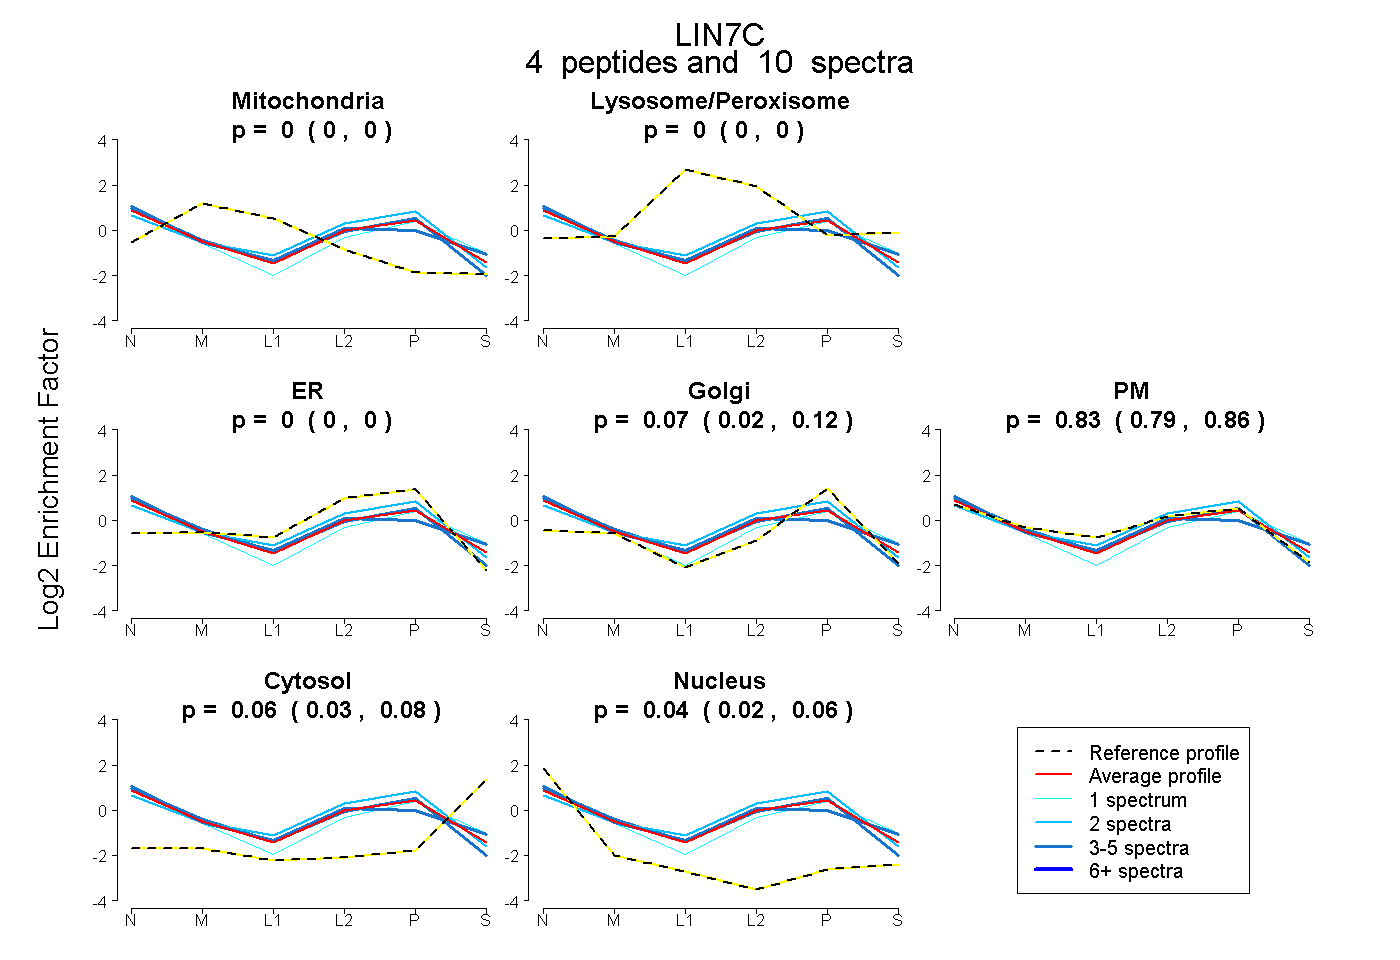
0.000 | 0.000
0.000 | 0.000
0.000 | 0.000
0.024 | 0.118
0.788 | 0.863
0.028 | 0.083
0.020 | 0.059
4peptides
spectra
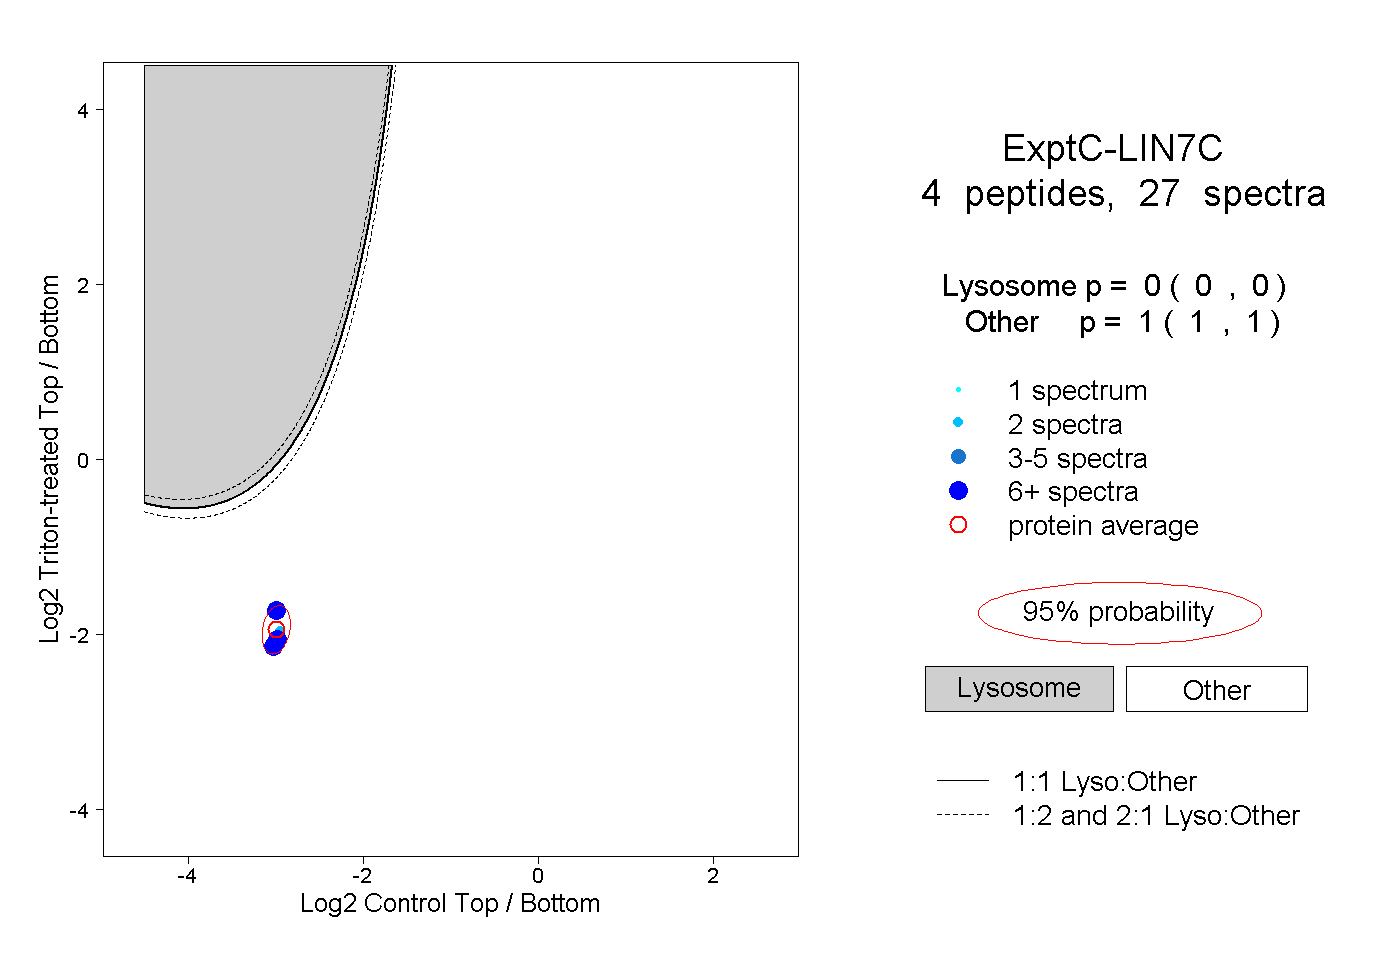
0.000 | 0.000
1.000 | 1.000
5peptides
spectra

0.000 | 0.000
1.000 | 1.000