 5
5peptides
spectra
0.000 | 0.000
0.000 | 0.000
0.021 | 0.050
0.168 | 0.239
0.000 | 0.000
0.568 | 0.661
0.091 | 0.132
0.007 | 0.034
| Plot | Mito | Lyso | Perox | ER | Golgi | PM | Cytosol | Nucleus | |||||
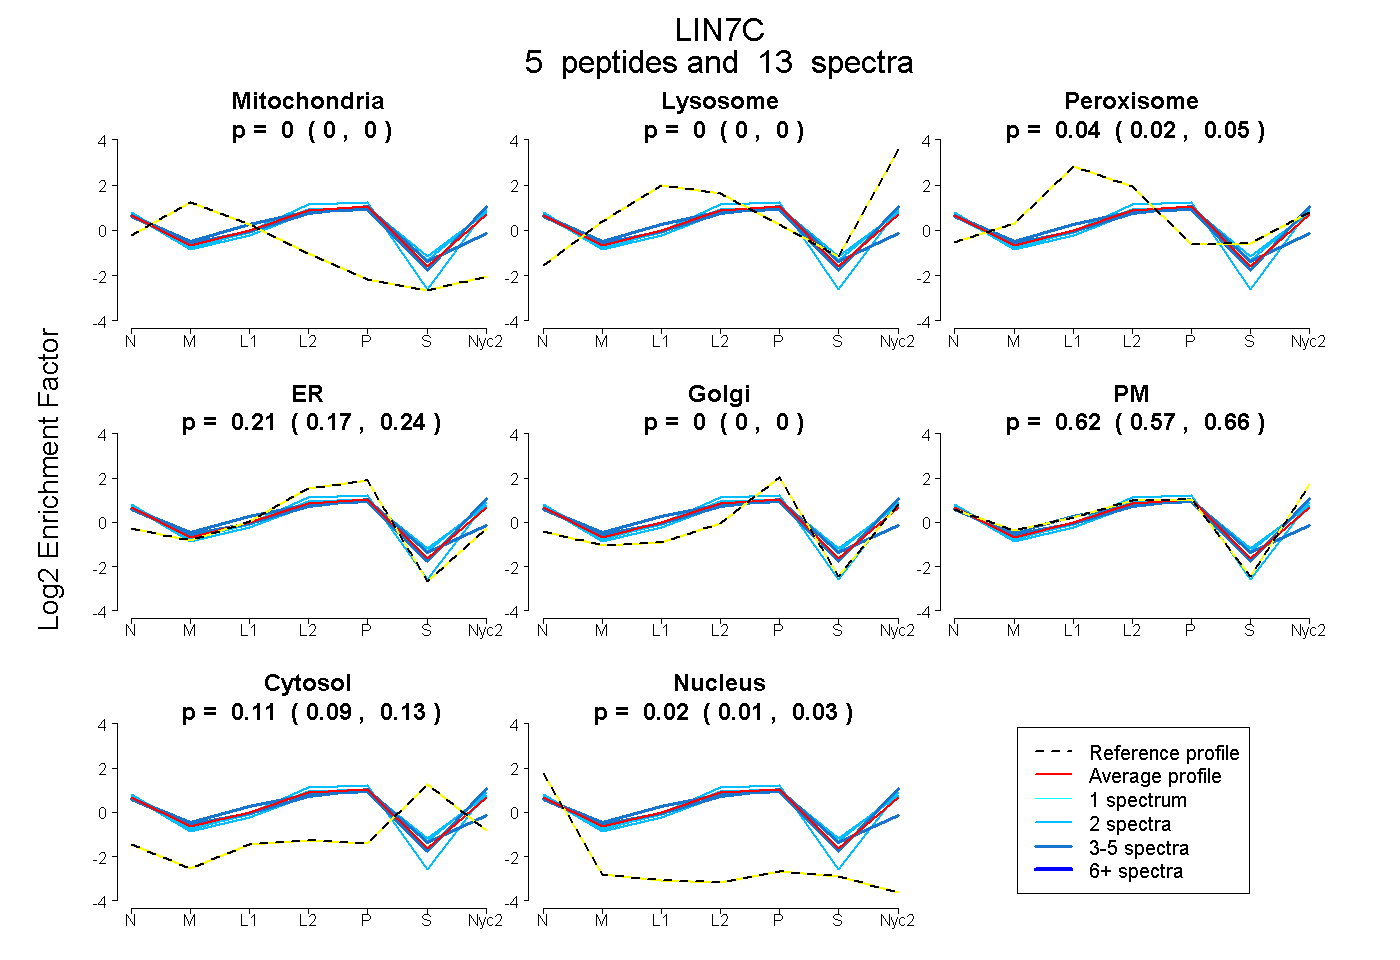
| Expt A |
5 peptides |
13 spectra |
|
0.000 0.000 | 0.000 |
0.000 0.000 | 0.000 |
0.037 0.021 | 0.050 |
0.208 0.168 | 0.239 |
0.000 0.000 | 0.000 |
0.618 0.568 | 0.661 |
0.113 0.091 | 0.132 |
0.022 0.007 | 0.034 |
| 2 spectra, LQALQR | 0.000 | 0.000 | 0.000 | 0.266 | 0.000 | 0.688 | 0.000 | 0.047 | ||
| 2 spectra, IIPGGIADR | 0.000 | 0.000 | 0.000 | 0.133 | 0.000 | 0.664 | 0.203 | 0.000 | ||
| 4 spectra, VLQSEFCNAVR | 0.000 | 0.000 | 0.111 | 0.415 | 0.000 | 0.287 | 0.114 | 0.073 | ||
| 2 spectra, TEEGLGFNIMGGK | 0.000 | 0.000 | 0.030 | 0.143 | 0.000 | 0.667 | 0.160 | 0.000 | ||
| 3 spectra, VLEEMESR | 0.000 | 0.000 | 0.084 | 0.073 | 0.000 | 0.748 | 0.074 | 0.021 |
| Plot | Mito | Lyso or Perox | ER | Golgi | PM | Cytosol | Nucleus | ||||||
| Expt B |
4 peptides |
10 spectra |
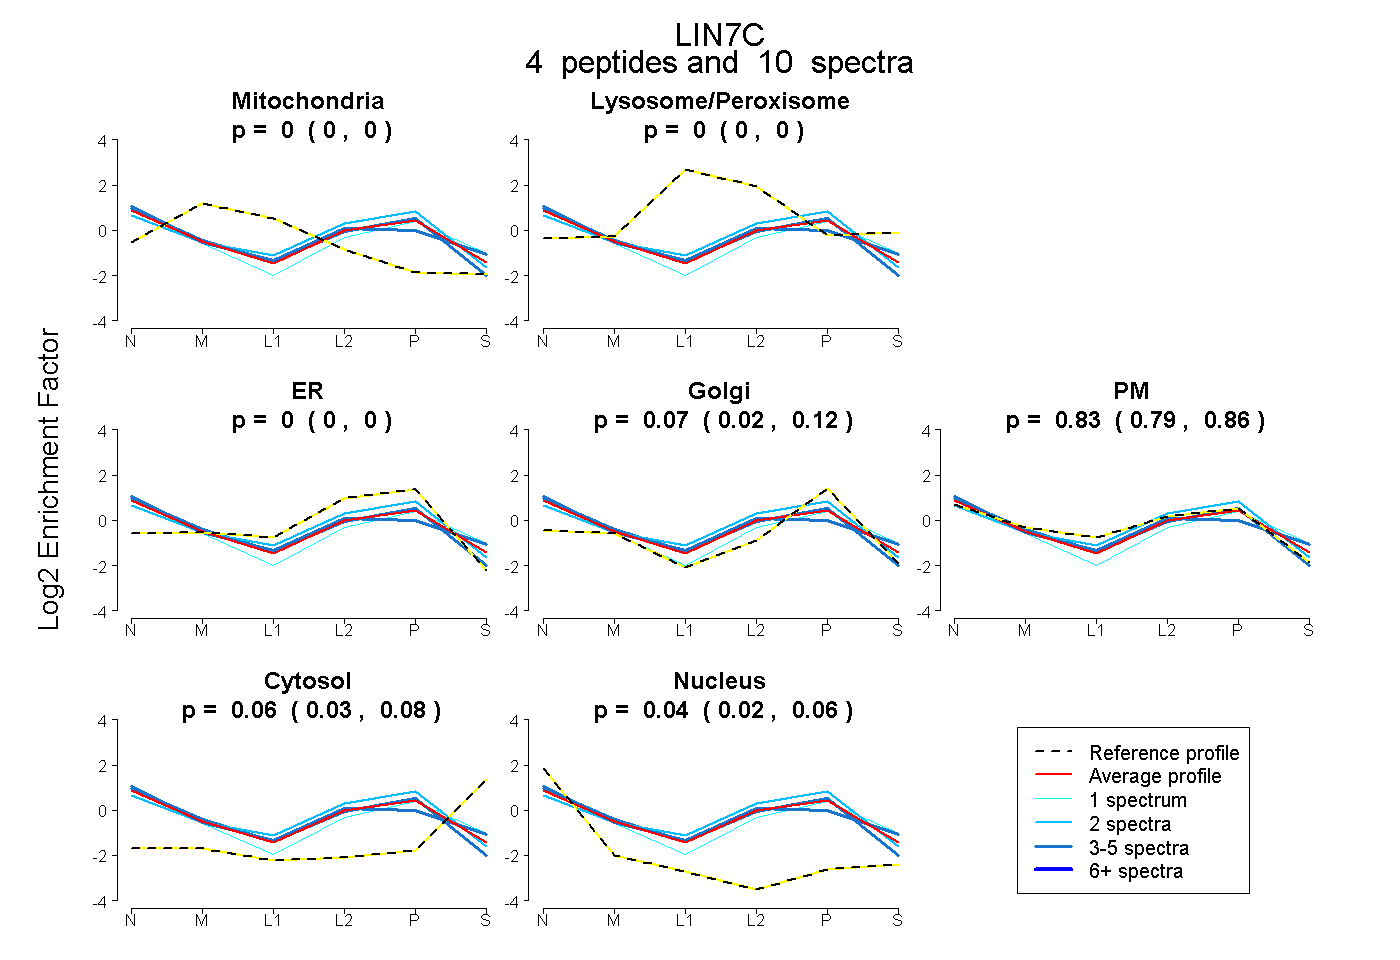 |
0.000 0.000 | 0.000 |
0.000 0.000 | 0.000 |
0.000 0.000 | 0.000 |
0.073 0.024 | 0.118 |
0.829 0.788 | 0.863 |
0.057 0.028 | 0.083 |
0.041 0.020 | 0.059 |
|||
| Plot | Lyso | Other | |||||||||||
| Expt C |
4 peptides |
27 spectra |
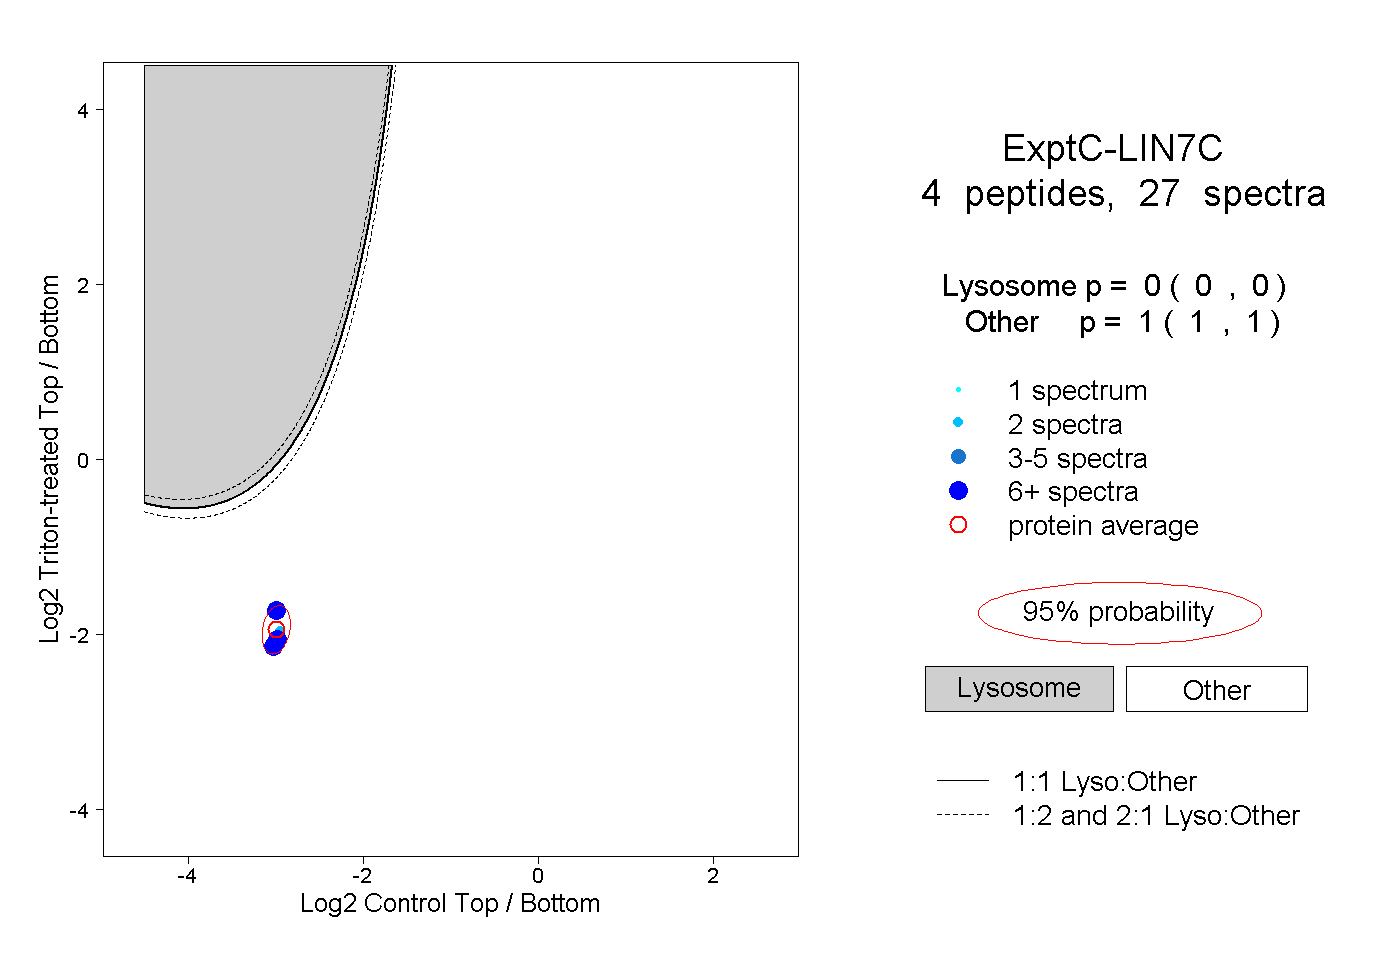 |
0.000 0.000 | 0.000 |
1.000 1.000 | 1.000 |
||||||||
| Plot | Lyso | Other | |||||||||||
| Expt D |
5 peptides |
13 spectra |
 |
0.000 0.000 | 0.000 |
1.000 1.000 | 1.000 |