 17
17peptides
spectra
0.000 | 0.000
0.000 | 0.000
0.000 | 0.000
0.048 | 0.098
0.109 | 0.154
0.174 | 0.212
0.565 | 0.576
0.020 | 0.030
3peptides
spectra
0.000 | 0.000
1.000 | 1.000
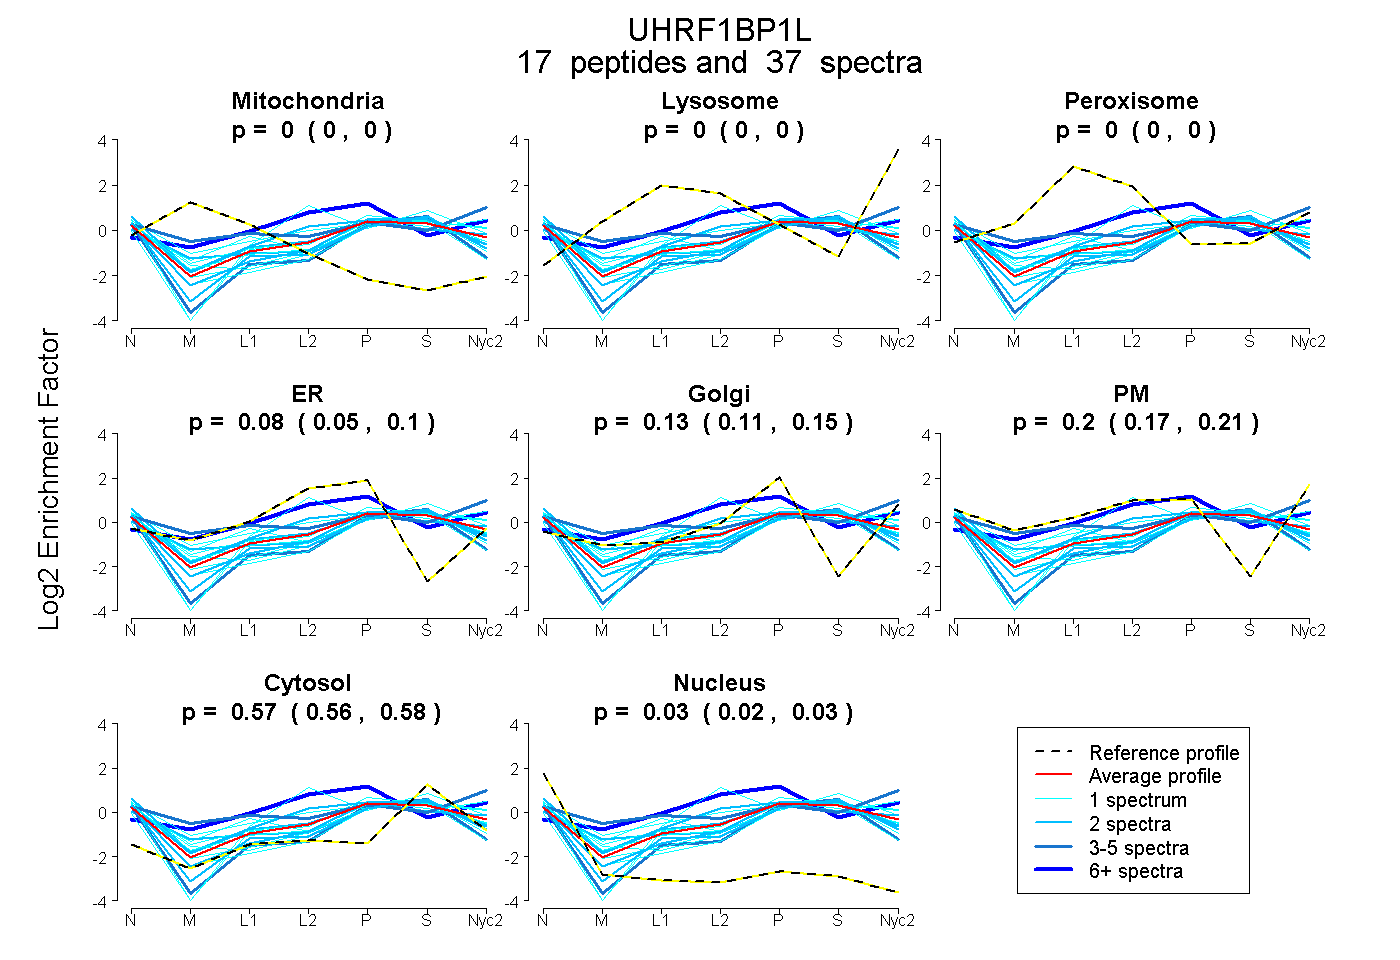
| Plot | Mito | Lyso | Perox | ER | Golgi | PM | Cytosol | Nucleus | |||||
| Expt A |
17 peptides |
37 spectra |
|
0.000 0.000 | 0.000 |
0.000 0.000 | 0.000 |
0.000 0.000 | 0.000 |
0.077 0.048 | 0.098 |
0.132 0.109 | 0.154 |
0.195 0.174 | 0.212 |
0.571 0.565 | 0.576 |
0.025 0.020 | 0.030 |
||
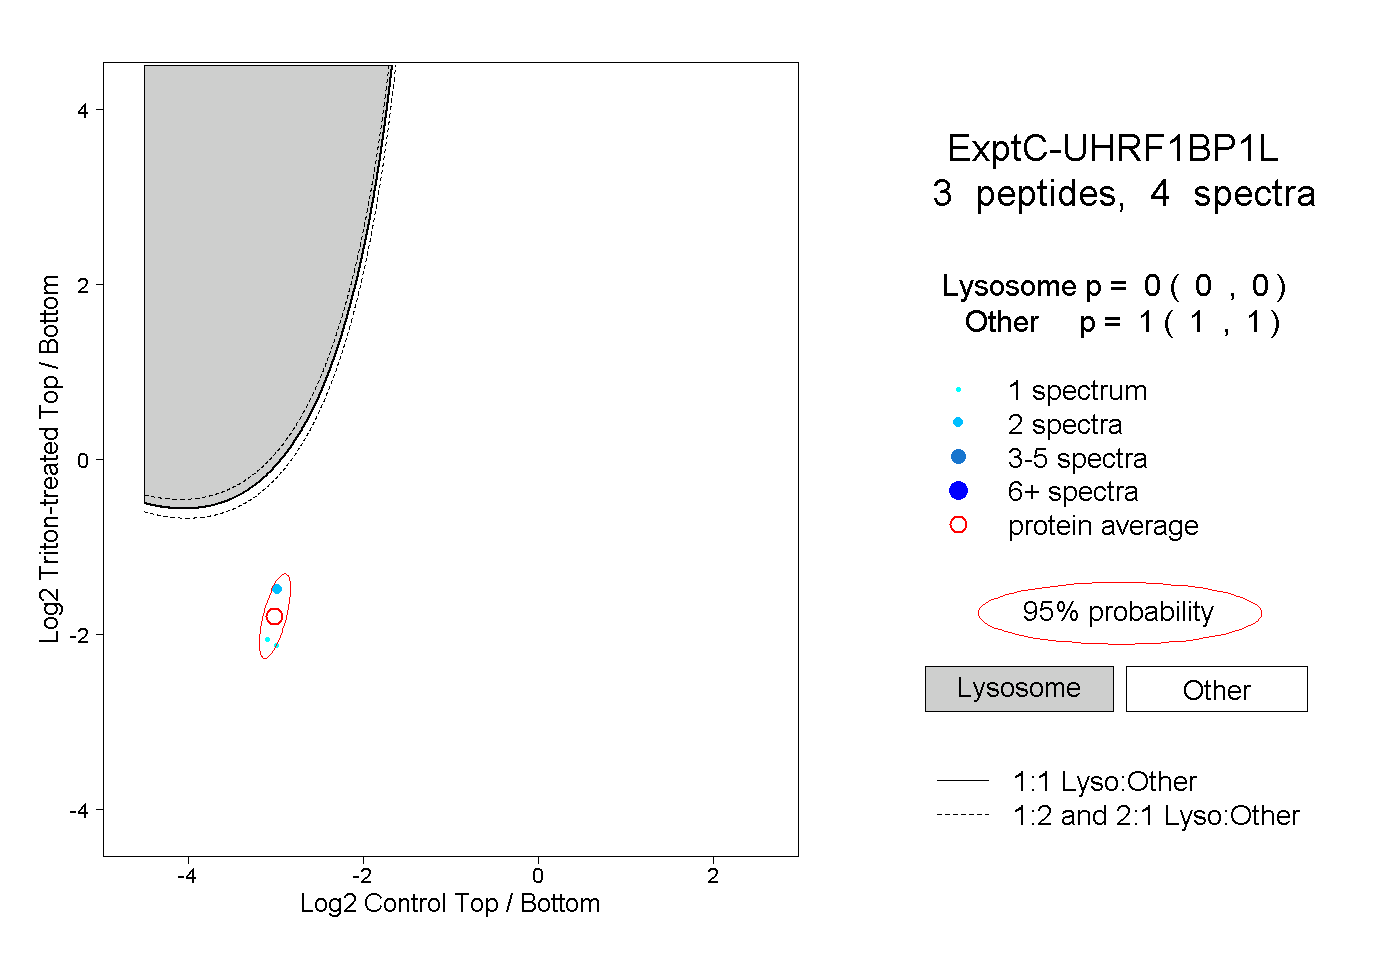
| Plot | Lyso | Other | |||||||||||
| Expt C |
3 peptides |
4 spectra |
|
0.000 0.000 | 0.000 |
1.000 1.000 | 1.000 |