 6
6peptides
spectra
0.000 | 0.000
0.400 | 0.465
0.000 | 0.000
0.000 | 0.055
0.000 | 0.049
0.329 | 0.417
0.140 | 0.173
0.000 | 0.000
7peptides
spectra
0.000 | 0.001
0.999 | 1.000
| Plot | Mito | Lyso | Perox | ER | Golgi | PM | Cytosol | Nucleus | |||||
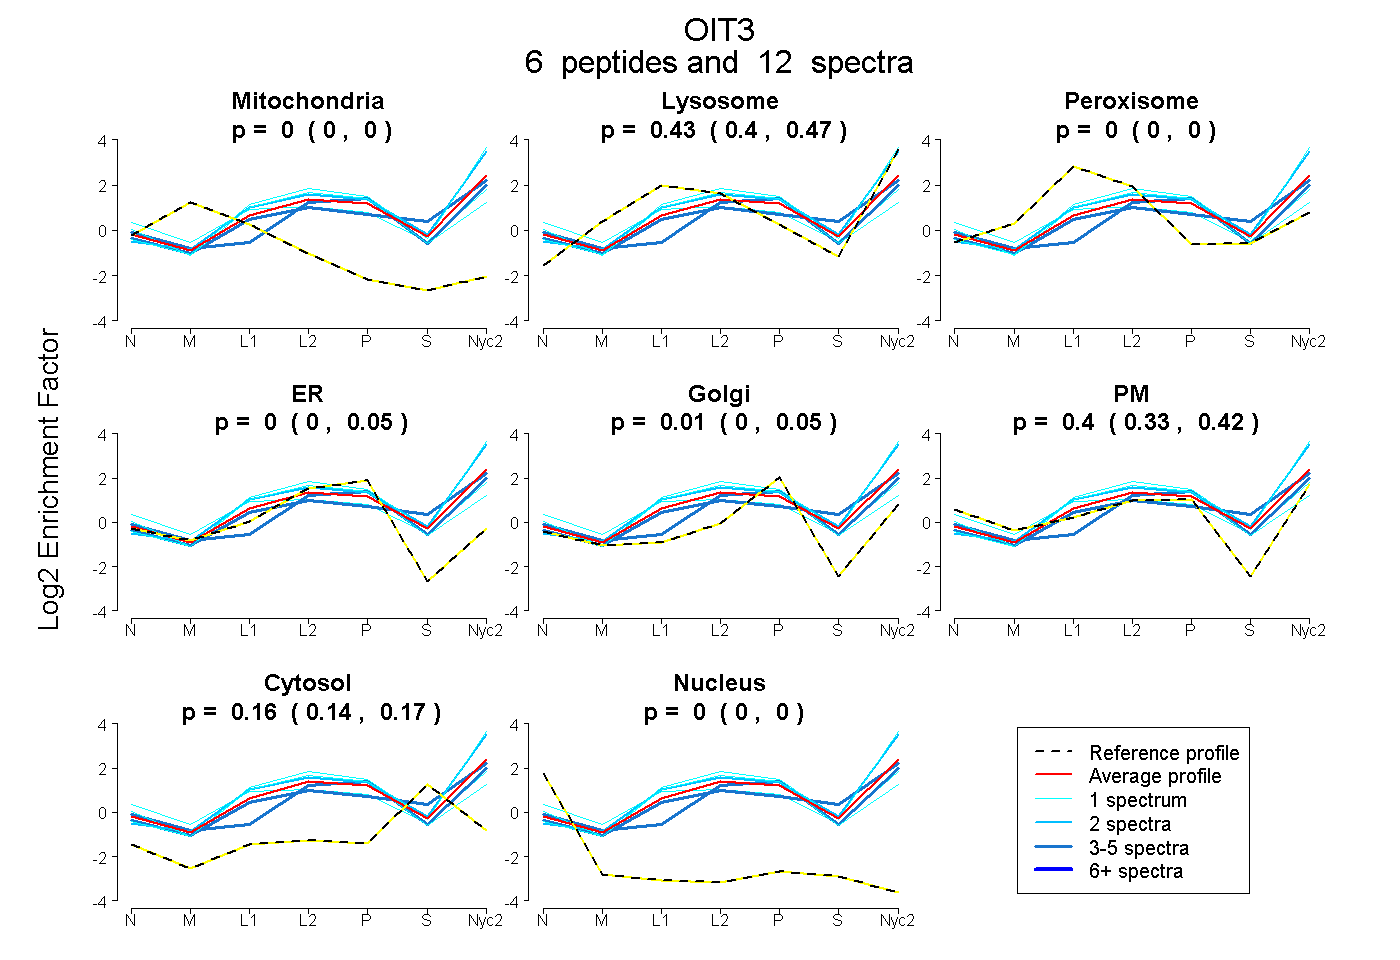
| Expt A |
6 peptides |
12 spectra |
|
0.000 0.000 | 0.000 |
0.433 0.400 | 0.465 |
0.000 0.000 | 0.000 |
0.000 0.000 | 0.055 |
0.013 0.000 | 0.049 |
0.396 0.329 | 0.417 |
0.159 0.140 | 0.173 |
0.000 0.000 | 0.000 |
||
| Plot | Lyso | Other | |||||||||||
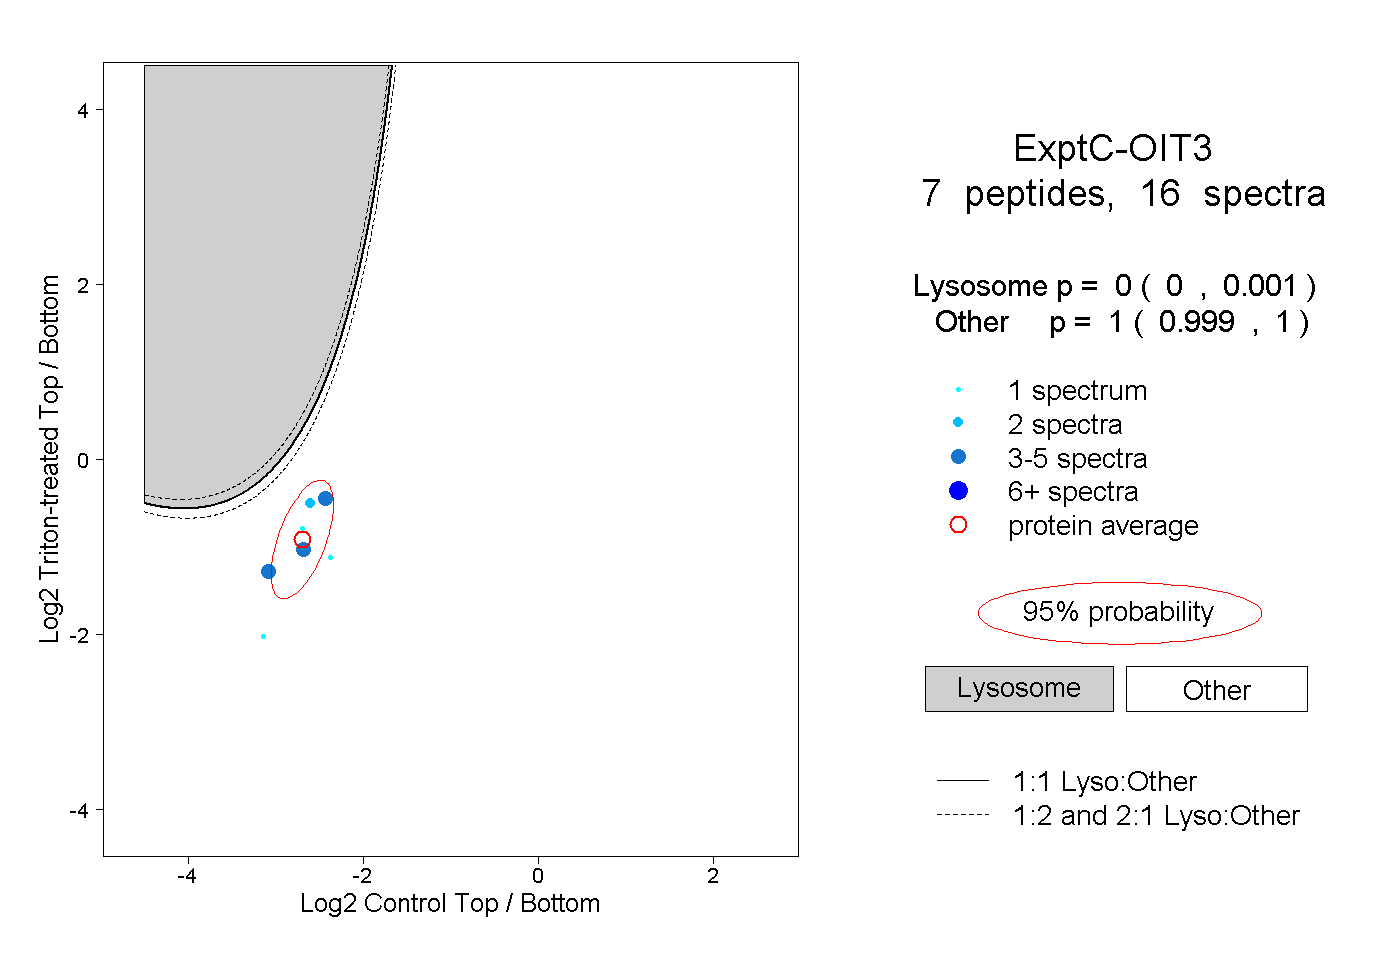
| Expt C |
7 peptides |
16 spectra |
|
0.000 0.000 | 0.001 |
1.000 0.999 | 1.000 |