 6
6peptides
spectra
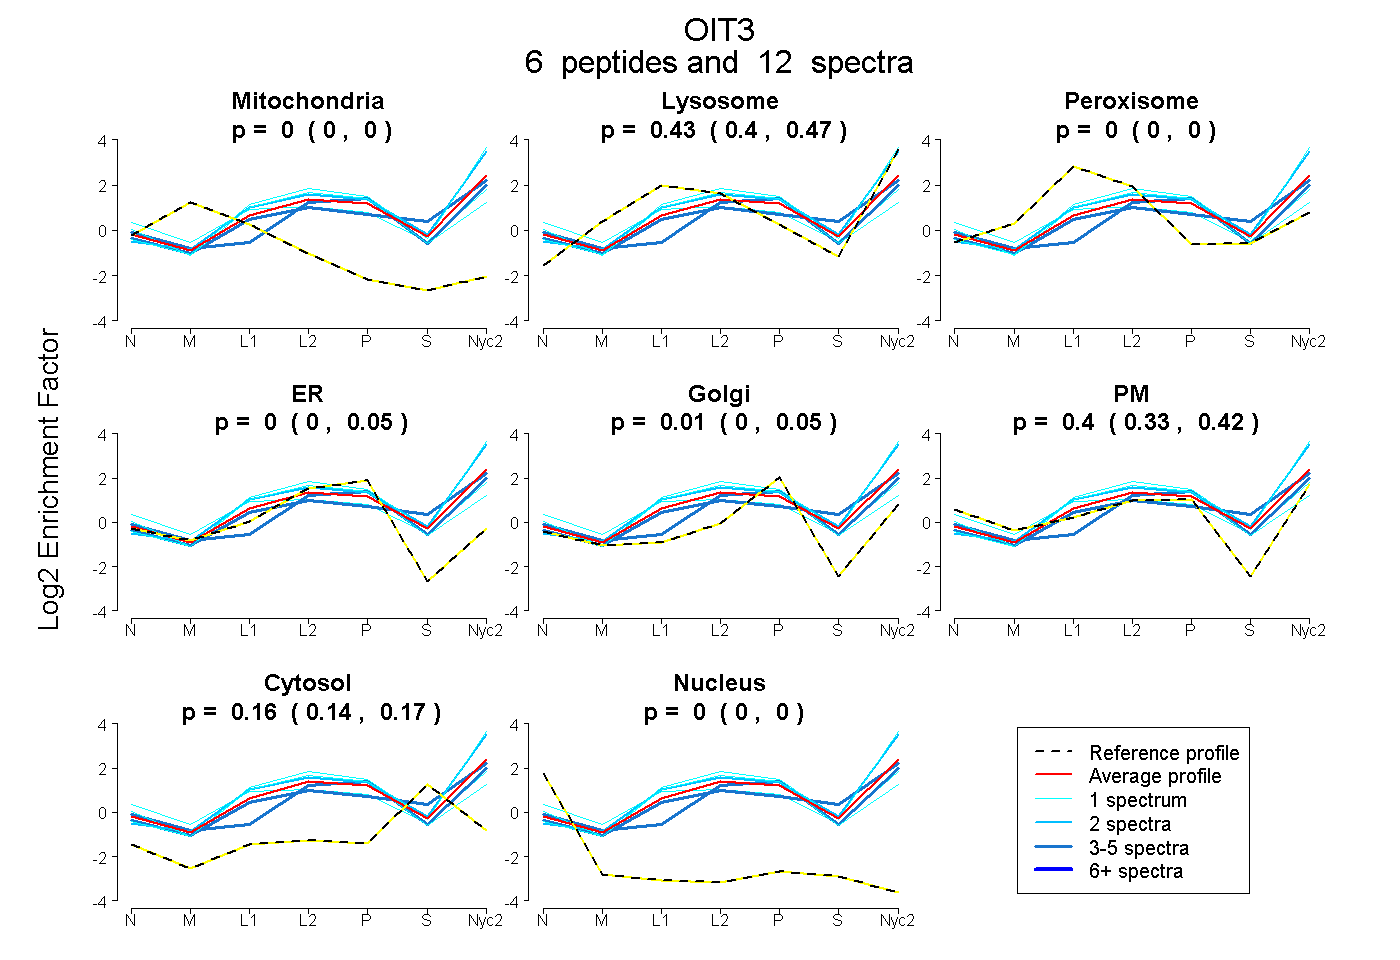
0.000 | 0.000
0.400 | 0.465
0.000 | 0.000
0.000 | 0.055
0.000 | 0.049
0.329 | 0.417
0.140 | 0.173
0.000 | 0.000
| Plot | Mito | Lyso | Perox | ER | Golgi | PM | Cytosol | Nucleus | |||||
| Expt A |
6 peptides |
12 spectra |
|
0.000 0.000 | 0.000 |
0.433 0.400 | 0.465 |
0.000 0.000 | 0.000 |
0.000 0.000 | 0.055 |
0.013 0.000 | 0.049 |
0.396 0.329 | 0.417 |
0.159 0.140 | 0.173 |
0.000 0.000 | 0.000 |
| 1 spectrum, QTPGSSGDIIIR | 0.000 | 0.706 | 0.000 | 0.000 | 0.101 | 0.170 | 0.023 | 0.000 | ||
| 1 spectrum, DGCVSDDSVK | 0.000 | 0.187 | 0.195 | 0.000 | 0.000 | 0.486 | 0.132 | 0.000 | ||
| 2 spectra, LYTISEGYVPNLR | 0.000 | 0.702 | 0.000 | 0.000 | 0.100 | 0.136 | 0.061 | 0.000 | ||
| 4 spectra, GYQCECPR | 0.000 | 0.238 | 0.000 | 0.000 | 0.238 | 0.373 | 0.152 | 0.000 | ||
| 3 spectra, HFQVPVFK | 0.000 | 0.474 | 0.000 | 0.000 | 0.000 | 0.227 | 0.299 | 0.000 | ||
| 1 spectrum, VLVCGVLDER | 0.000 | 0.178 | 0.206 | 0.315 | 0.000 | 0.203 | 0.097 | 0.000 |
| Plot | Lyso | Other | |||||||||||
| Expt C |
7 peptides |
16 spectra |
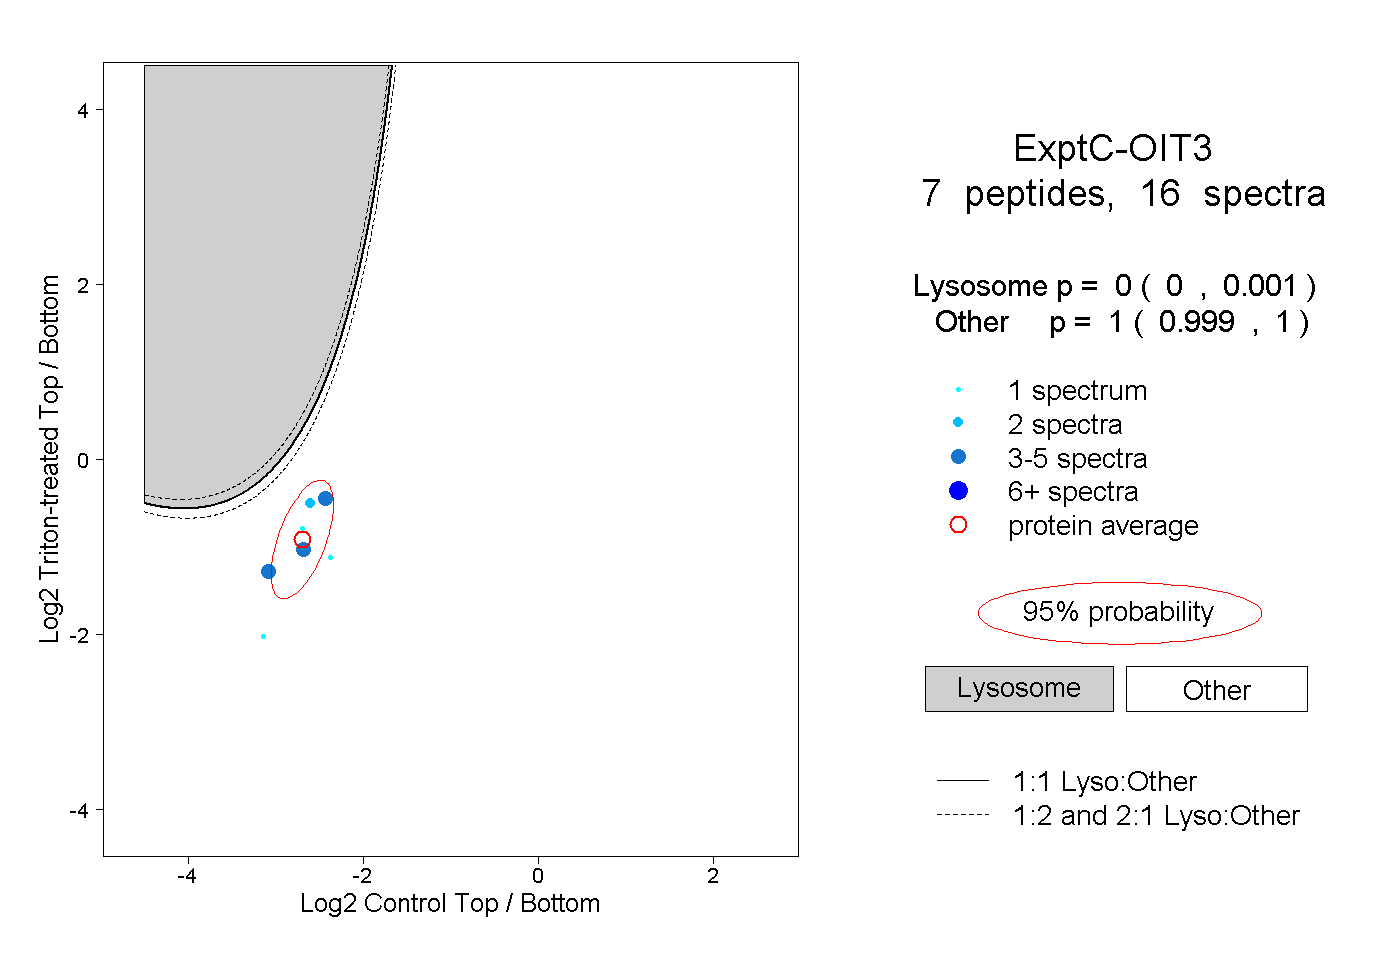 |
0.000 0.000 | 0.001 |
1.000 0.999 | 1.000 |