 2
2peptides
spectra
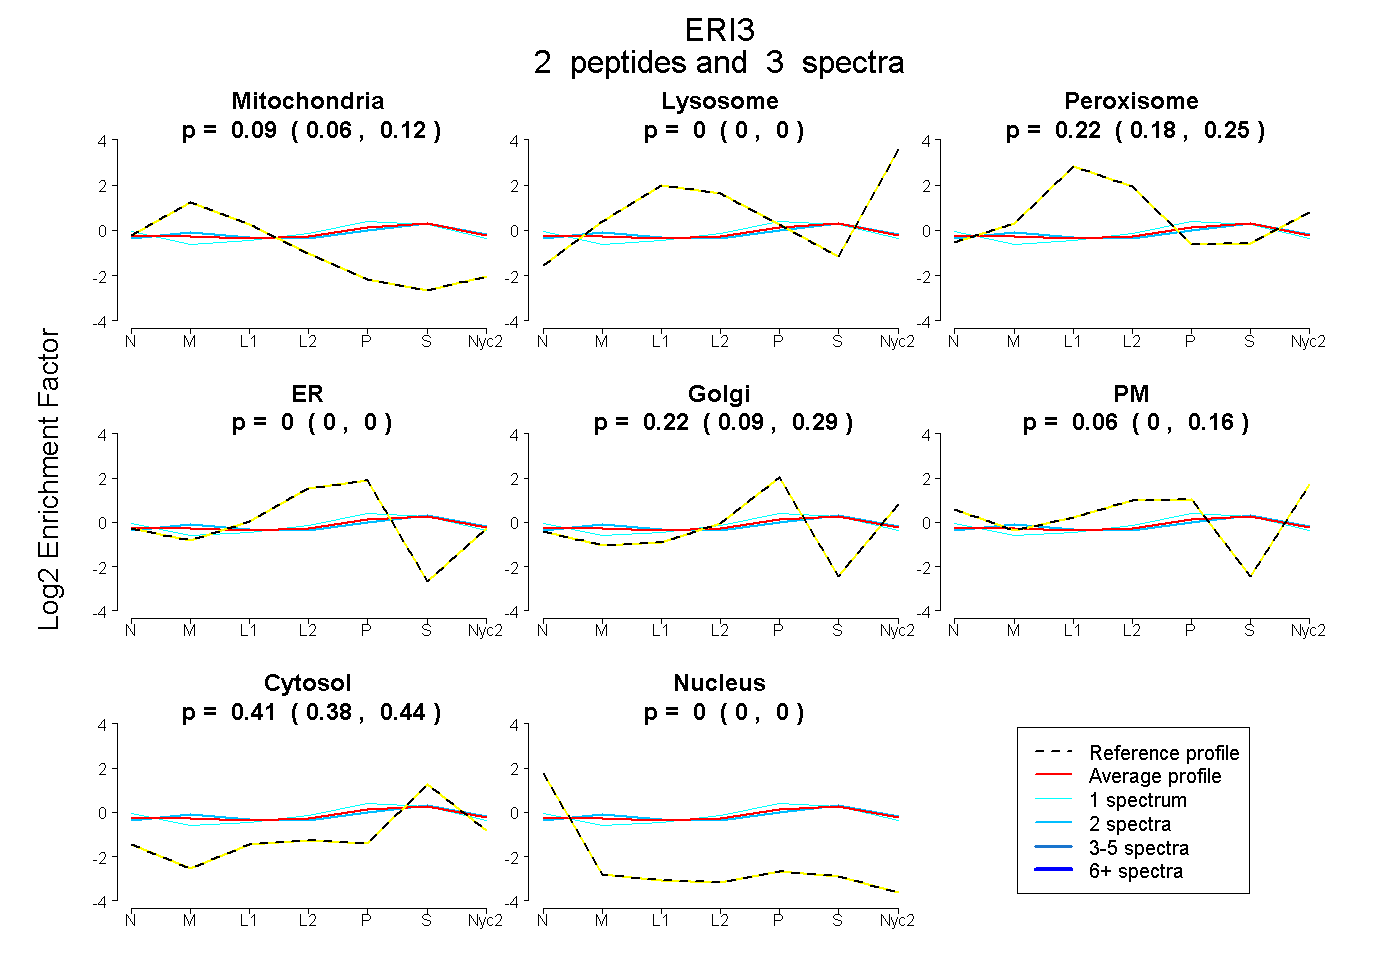
0.057 | 0.118
0.000 | 0.000
0.177 | 0.249
0.000 | 0.000
0.089 | 0.292
0.000 | 0.157
0.376 | 0.441
0.000 | 0.000
1peptide
spectrum
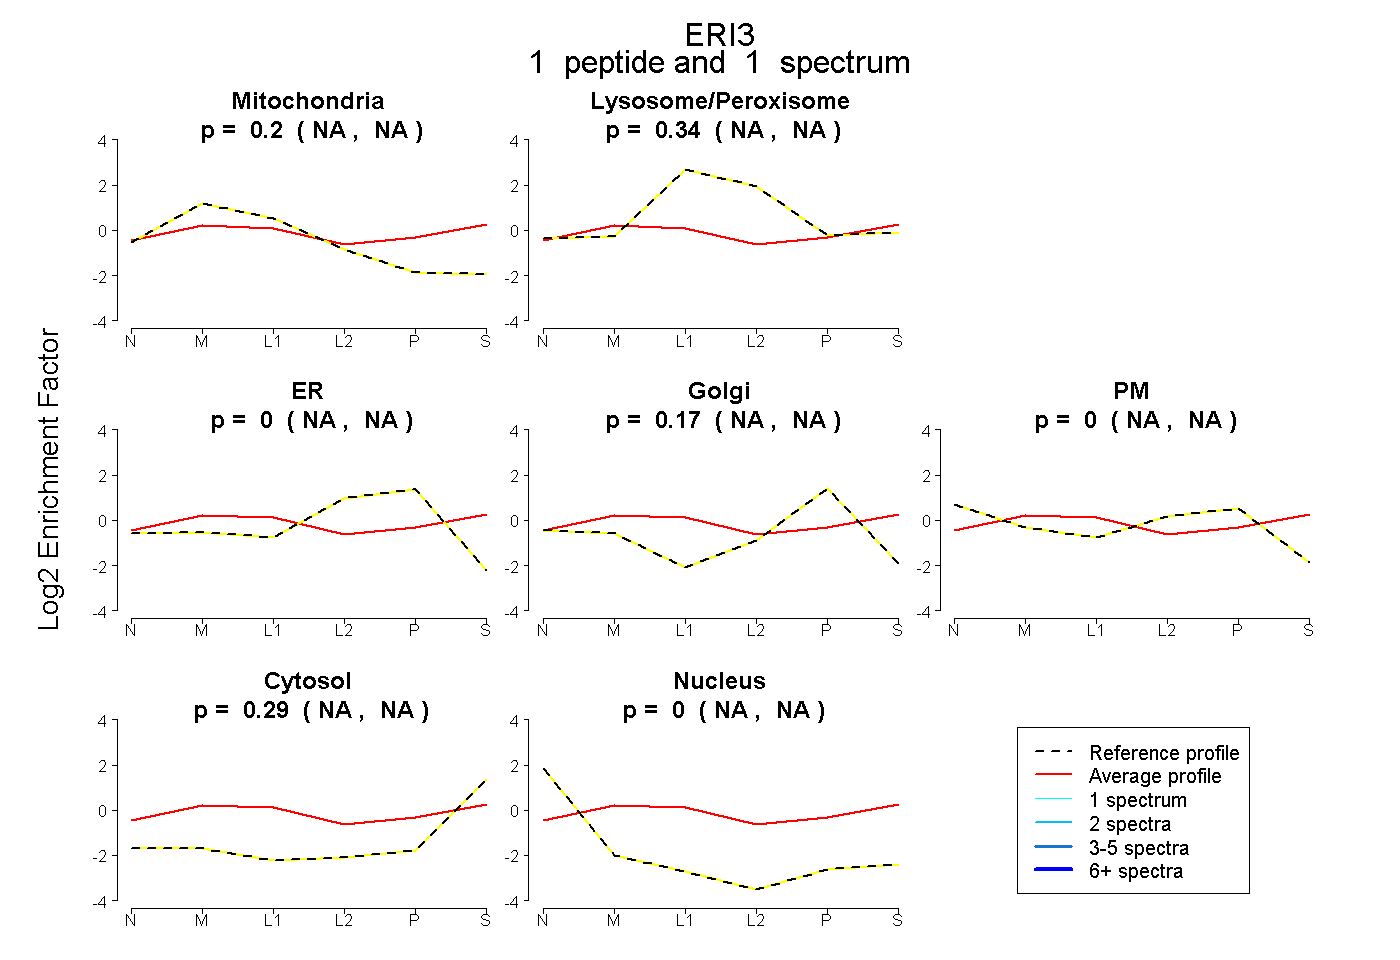
NA | NA
NA | NA
NA | NA
NA | NA
NA | NA
NA | NA
NA | NA
2peptides
spectra
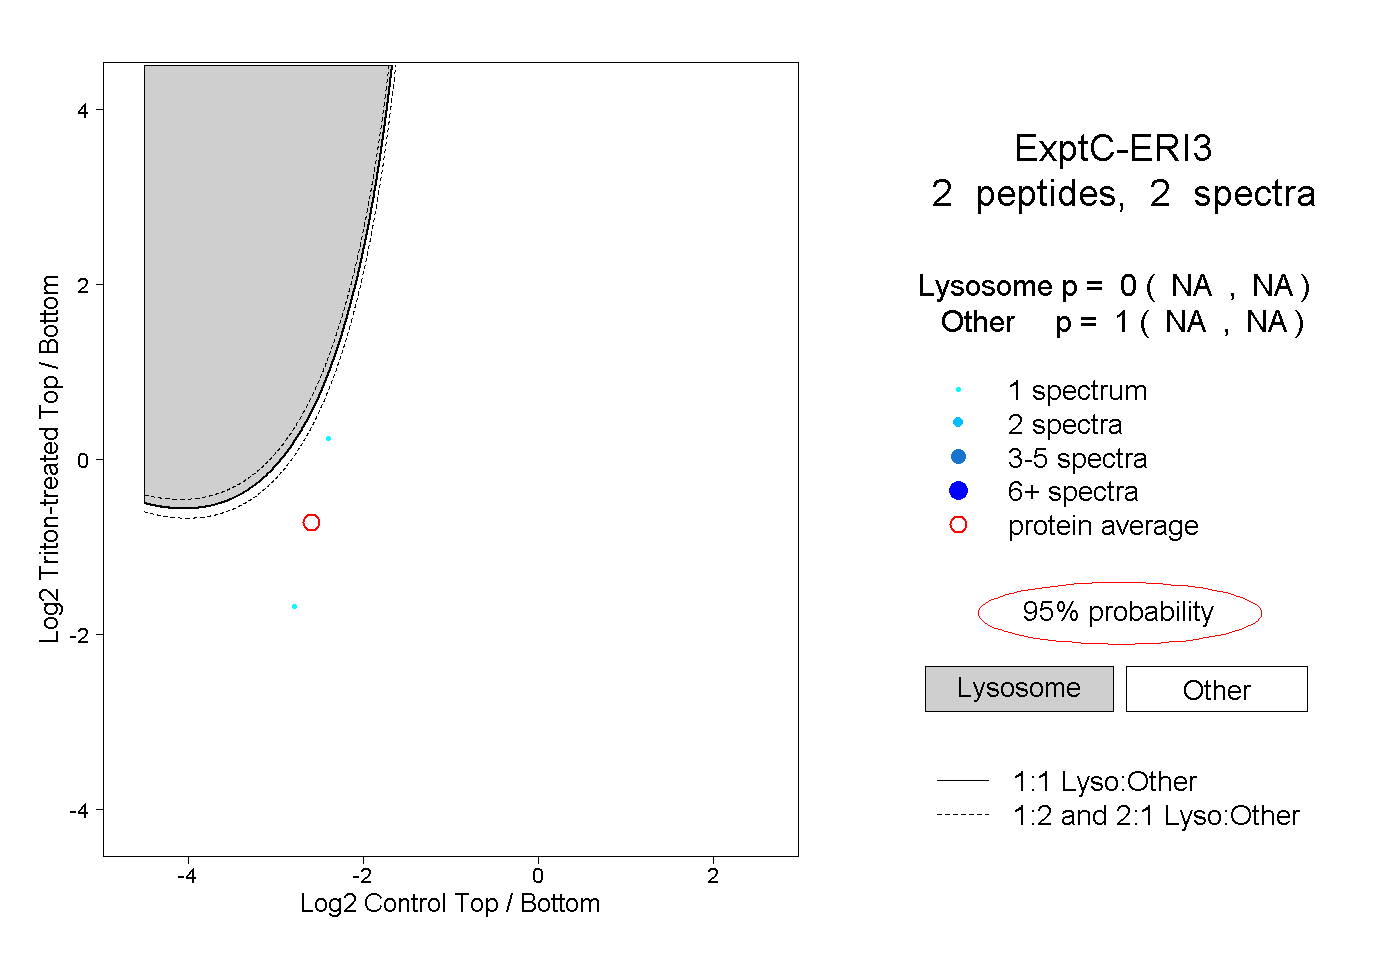
NA | NA
NA | NA