 2
2peptides
spectra
0.057 | 0.118
0.000 | 0.000
0.177 | 0.249
0.000 | 0.000
0.089 | 0.292
0.000 | 0.157
0.376 | 0.441
0.000 | 0.000
| Plot | Mito | Lyso | Perox | ER | Golgi | PM | Cytosol | Nucleus | |||||
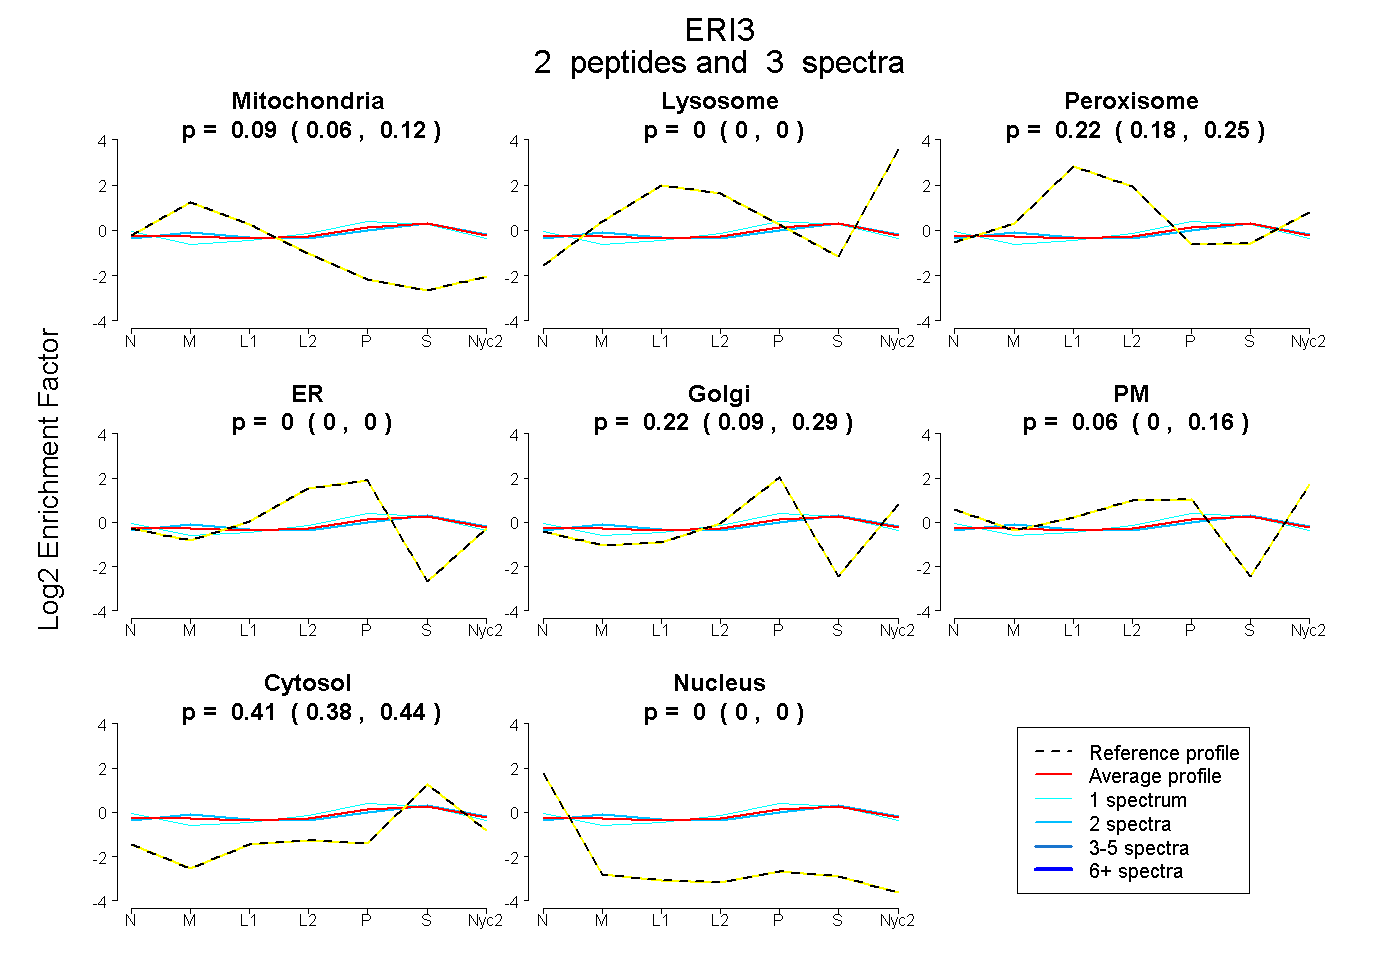
| Expt A |
2 peptides |
3 spectra |
|
0.091 0.057 | 0.118 |
0.000 0.000 | 0.000 |
0.222 0.177 | 0.249 |
0.000 0.000 | 0.000 |
0.221 0.089 | 0.292 |
0.057 0.000 | 0.157 |
0.410 0.376 | 0.441 |
0.000 0.000 | 0.000 |
| 1 spectrum, VDEWMAK | 0.036 | 0.000 | 0.155 | 0.109 | 0.137 | 0.121 | 0.441 | 0.000 | ||
| 2 spectra, NIANIMK | 0.114 | 0.000 | 0.234 | 0.000 | 0.198 | 0.048 | 0.406 | 0.000 |
| Plot | Mito | Lyso or Perox | ER | Golgi | PM | Cytosol | Nucleus | ||||||
| Expt B |
1 peptide |
1 spectrum |
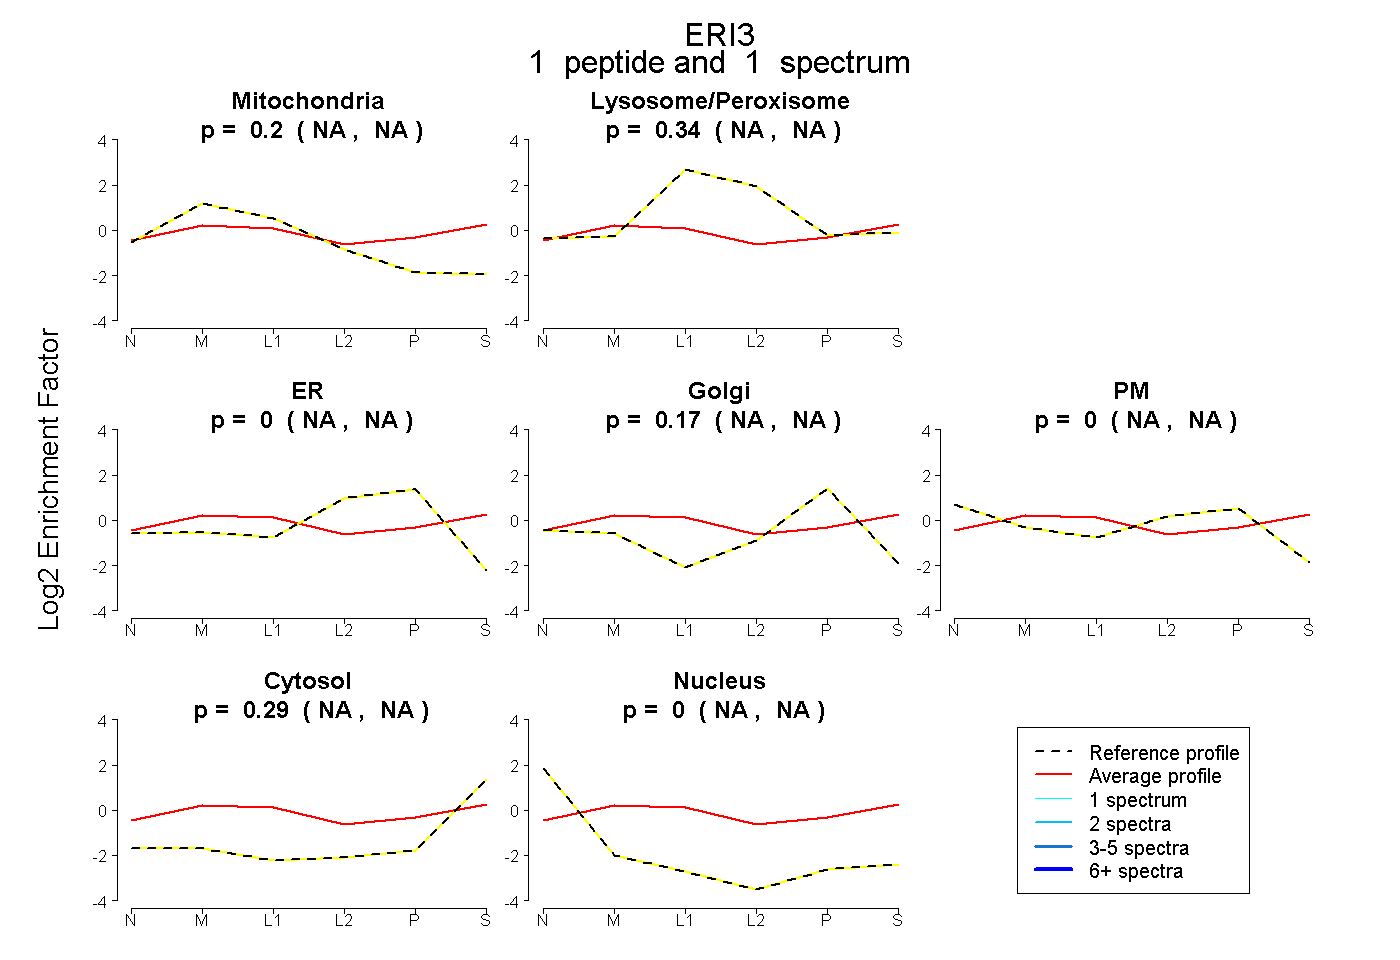 |
0.199 NA | NA |
0.342 NA | NA |
0.000 NA | NA |
0.170 NA | NA |
0.000 NA | NA |
0.290 NA | NA |
0.000 NA | NA |
|||
| Plot | Lyso | Other | |||||||||||
| Expt C |
2 peptides |
2 spectra |
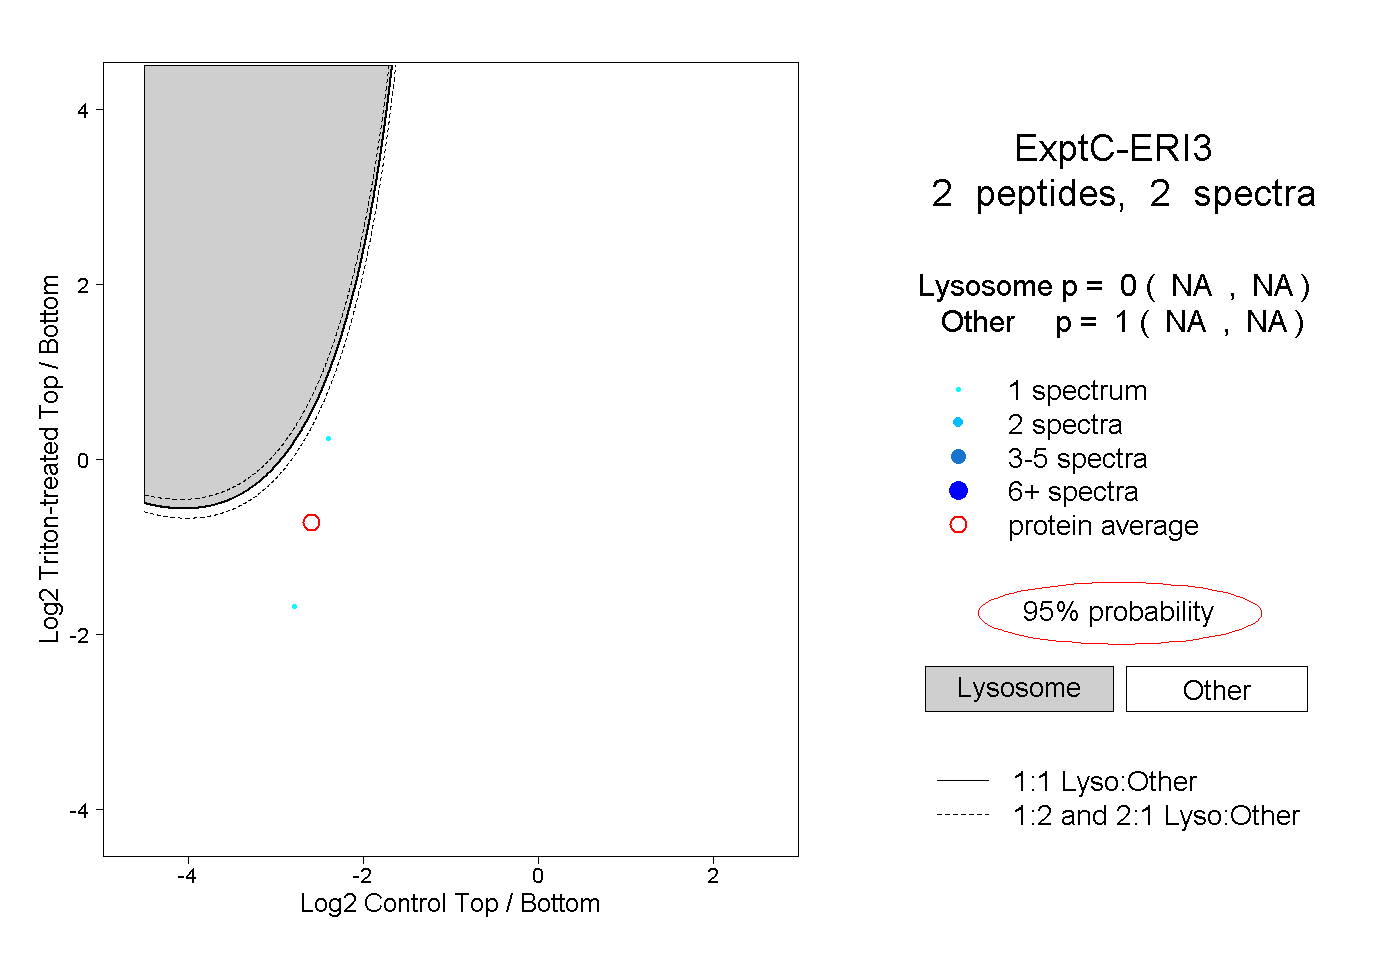 |
0.000 NA | NA |
1.000 NA | NA |