 12
12peptides
spectra
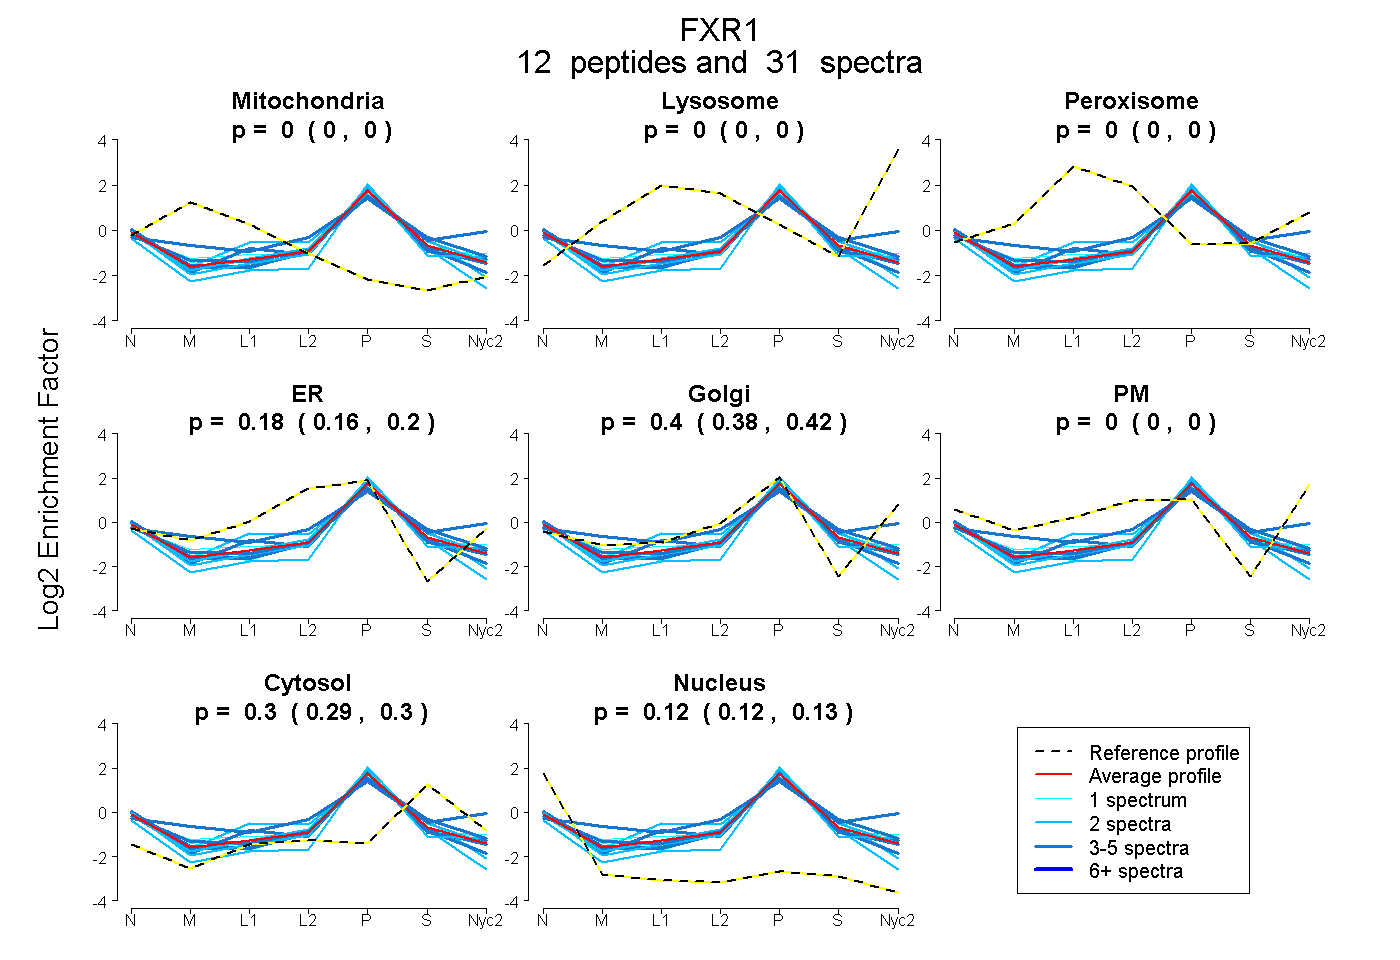
0.000 | 0.000
0.000 | 0.000
0.000 | 0.000
0.158 | 0.198
0.376 | 0.422
0.000 | 0.000
0.291 | 0.301
0.117 | 0.128
2peptides
spectra
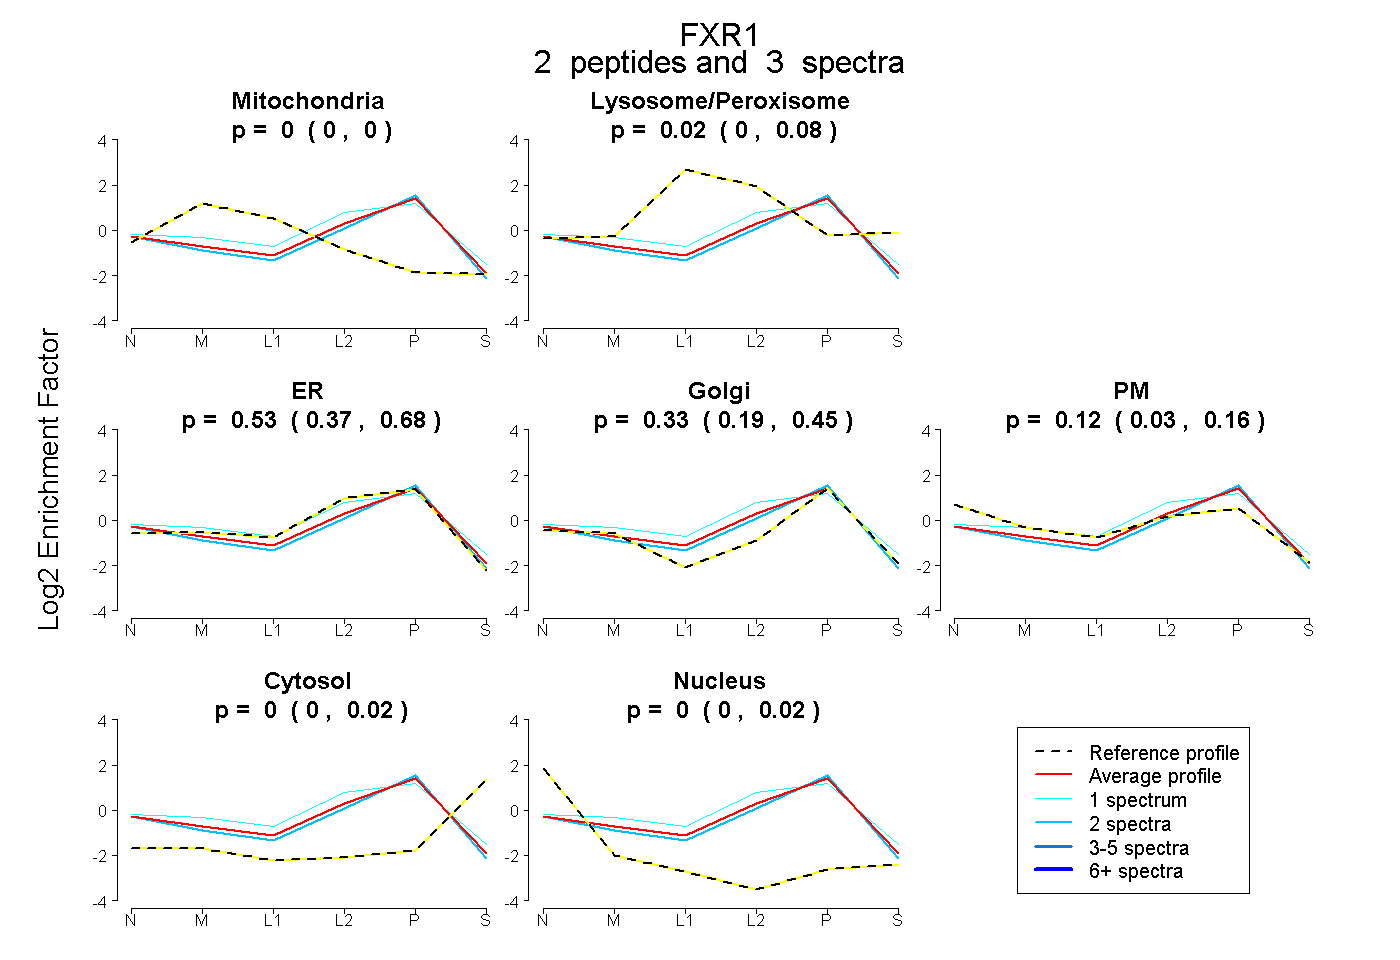
0.000 | 0.000
0.000 | 0.083
0.373 | 0.677
0.190 | 0.454
0.029 | 0.158
0.000 | 0.018
0.000 | 0.018
9peptides
spectra
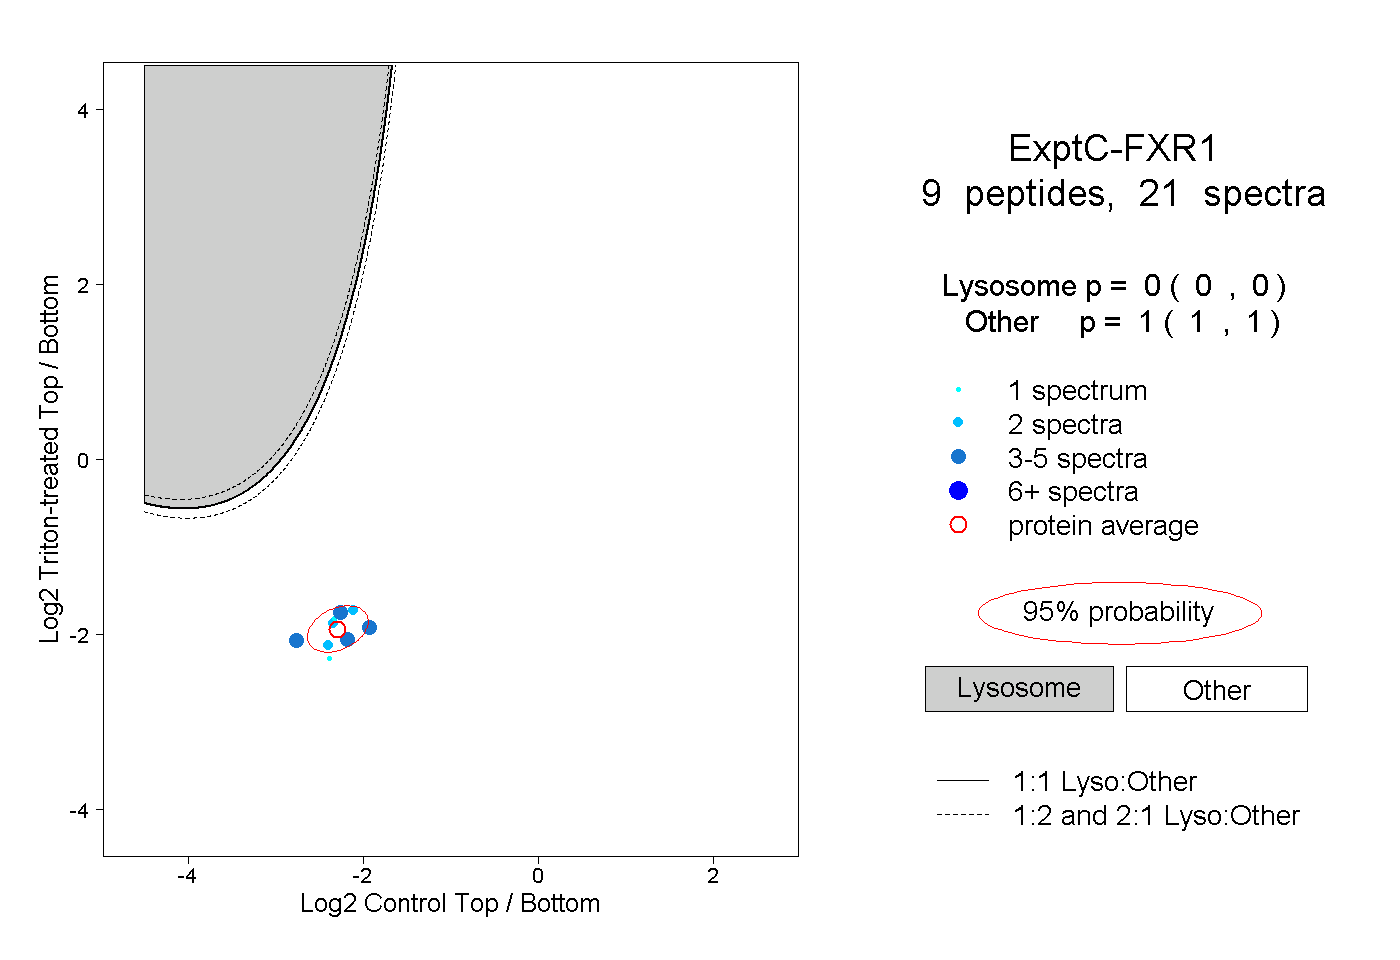
0.000 | 0.000
1.000 | 1.000
2peptides
spectra
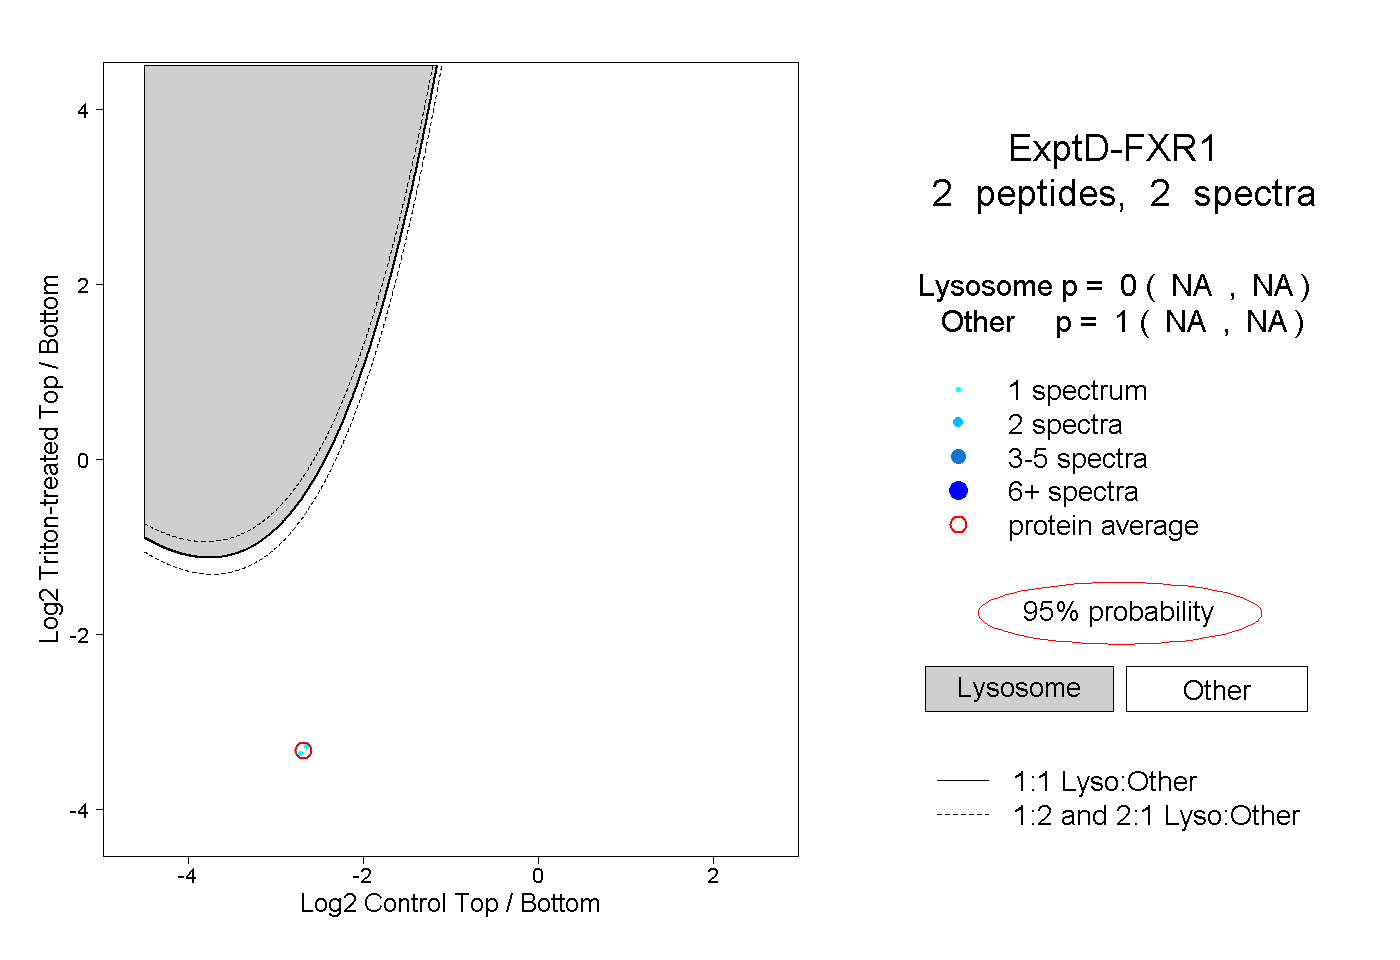
NA | NA
NA | NA