 12
12peptides
spectra
0.000 | 0.000
0.000 | 0.000
0.000 | 0.000
0.158 | 0.198
0.376 | 0.422
0.000 | 0.000
0.291 | 0.301
0.117 | 0.128
| Plot | Mito | Lyso | Perox | ER | Golgi | PM | Cytosol | Nucleus | |||||
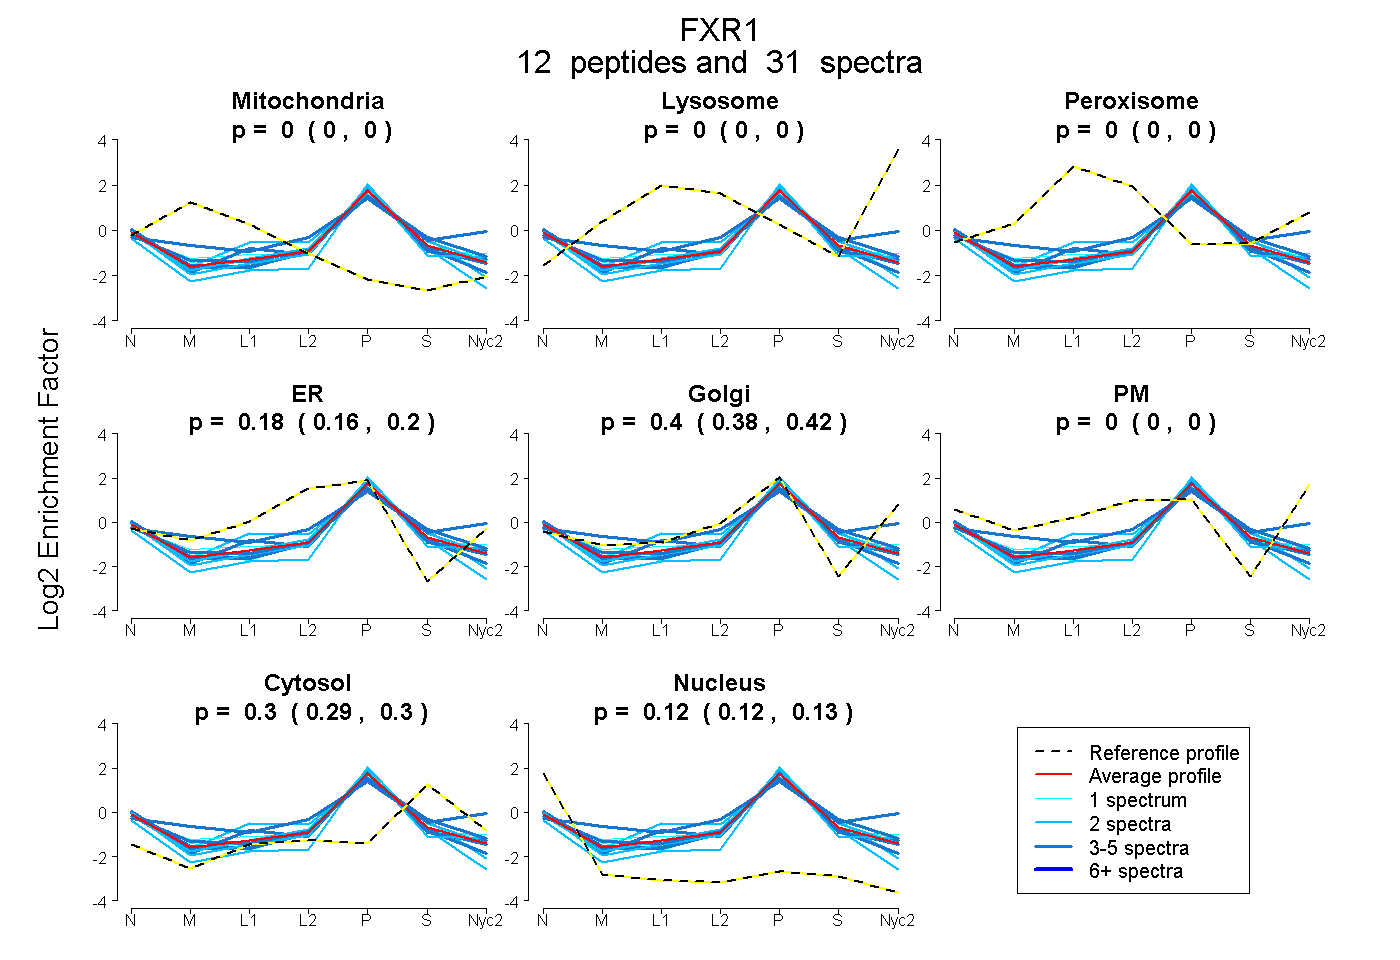
| Expt A |
12 peptides |
31 spectra |
|
0.000 0.000 | 0.000 |
0.000 0.000 | 0.000 |
0.000 0.000 | 0.000 |
0.181 0.158 | 0.198 |
0.400 0.376 | 0.422 |
0.000 0.000 | 0.000 |
0.297 0.291 | 0.301 |
0.123 0.117 | 0.128 |
| 3 spectra, EACANENAHK | 0.000 | 0.000 | 0.000 | 0.114 | 0.481 | 0.000 | 0.255 | 0.150 | ||
| 2 spectra, QLAAAFHEEFVVR | 0.000 | 0.000 | 0.000 | 0.032 | 0.608 | 0.000 | 0.206 | 0.154 | ||
| 3 spectra, VNILSDMHLR | 0.000 | 0.000 | 0.071 | 0.037 | 0.595 | 0.000 | 0.298 | 0.000 | ||
| 4 spectra, LRPVNQNK | 0.000 | 0.000 | 0.000 | 0.216 | 0.337 | 0.000 | 0.253 | 0.194 | ||
| 2 spectra, AVGACR | 0.000 | 0.000 | 0.000 | 0.525 | 0.000 | 0.000 | 0.365 | 0.110 | ||
| 1 spectrum, IYGESAEAVK | 0.000 | 0.000 | 0.000 | 0.046 | 0.550 | 0.000 | 0.280 | 0.124 | ||
| 1 spectrum, LPPPPDIK | 0.000 | 0.000 | 0.000 | 0.091 | 0.573 | 0.000 | 0.248 | 0.087 | ||
| 5 spectra, VIQEIVDK | 0.000 | 0.000 | 0.000 | 0.124 | 0.424 | 0.000 | 0.374 | 0.078 | ||
| 2 spectra, LMLMSR | 0.000 | 0.000 | 0.000 | 0.078 | 0.393 | 0.000 | 0.278 | 0.251 | ||
| 4 spectra, LQIDEQLR | 0.000 | 0.000 | 0.000 | 0.177 | 0.438 | 0.000 | 0.256 | 0.129 | ||
| 2 spectra, QVPFNEVR | 0.000 | 0.000 | 0.000 | 0.214 | 0.348 | 0.000 | 0.339 | 0.099 | ||
| 2 spectra, CTVDVPEDLR | 0.000 | 0.000 | 0.000 | 0.279 | 0.263 | 0.000 | 0.289 | 0.168 |
| Plot | Mito | Lyso or Perox | ER | Golgi | PM | Cytosol | Nucleus | ||||||
| Expt B |
2 peptides |
3 spectra |
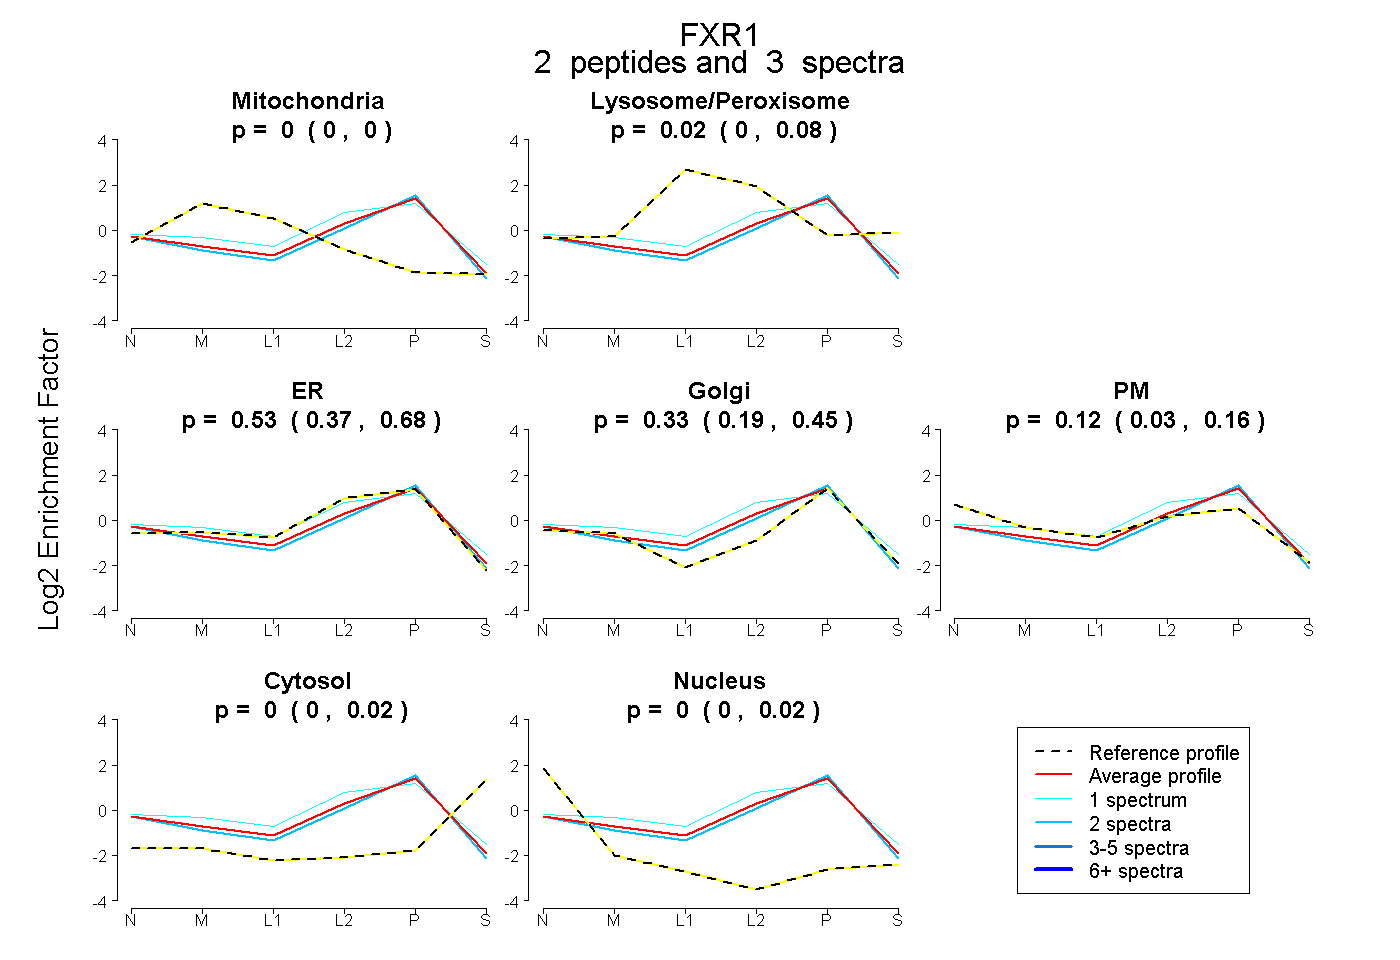 |
0.000 0.000 | 0.000 |
0.019 0.000 | 0.083 |
0.535 0.373 | 0.677 |
0.328 0.190 | 0.454 |
0.118 0.029 | 0.158 |
0.000 0.000 | 0.018 |
0.000 0.000 | 0.018 |
|||
| Plot | Lyso | Other | |||||||||||
| Expt C |
9 peptides |
21 spectra |
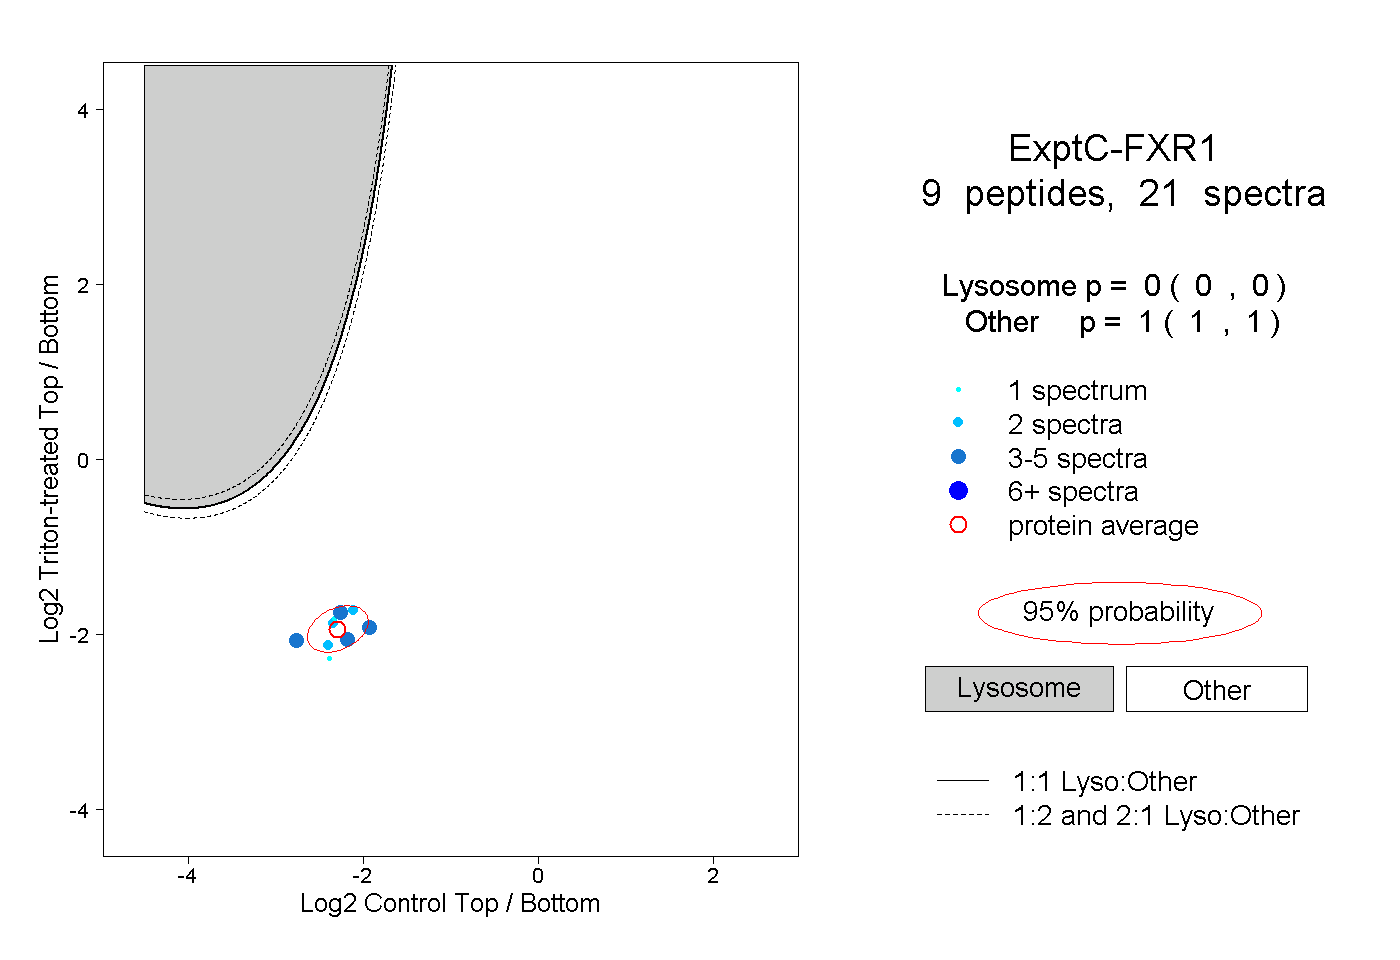 |
0.000 0.000 | 0.000 |
1.000 1.000 | 1.000 |
||||||||
| Plot | Lyso | Other | |||||||||||
| Expt D |
2 peptides |
2 spectra |
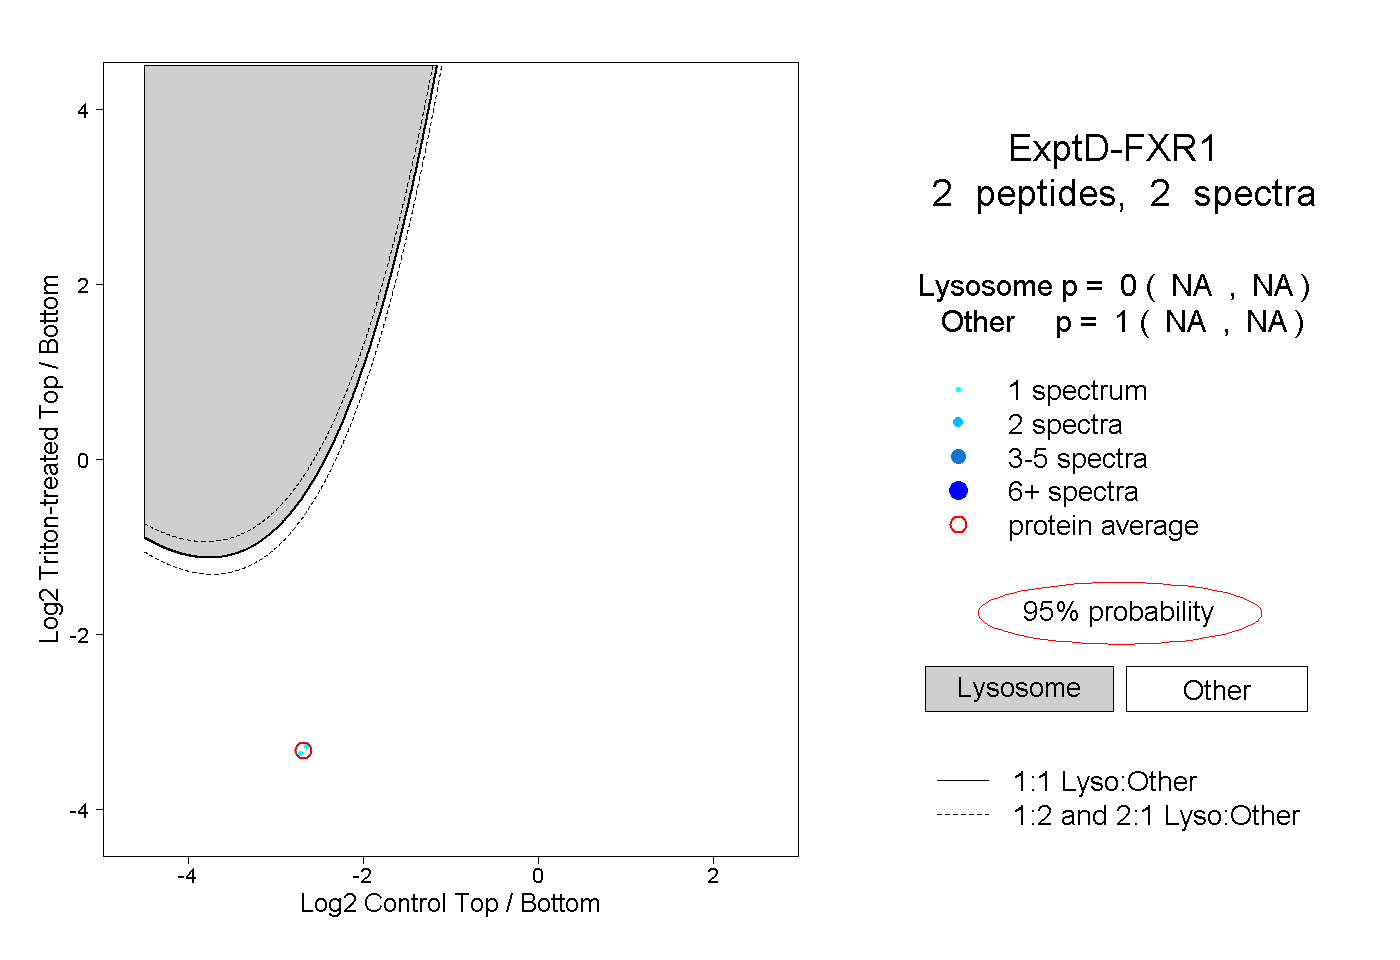 |
0.000 NA | NA |
1.000 NA | NA |