 2
2peptides
spectra
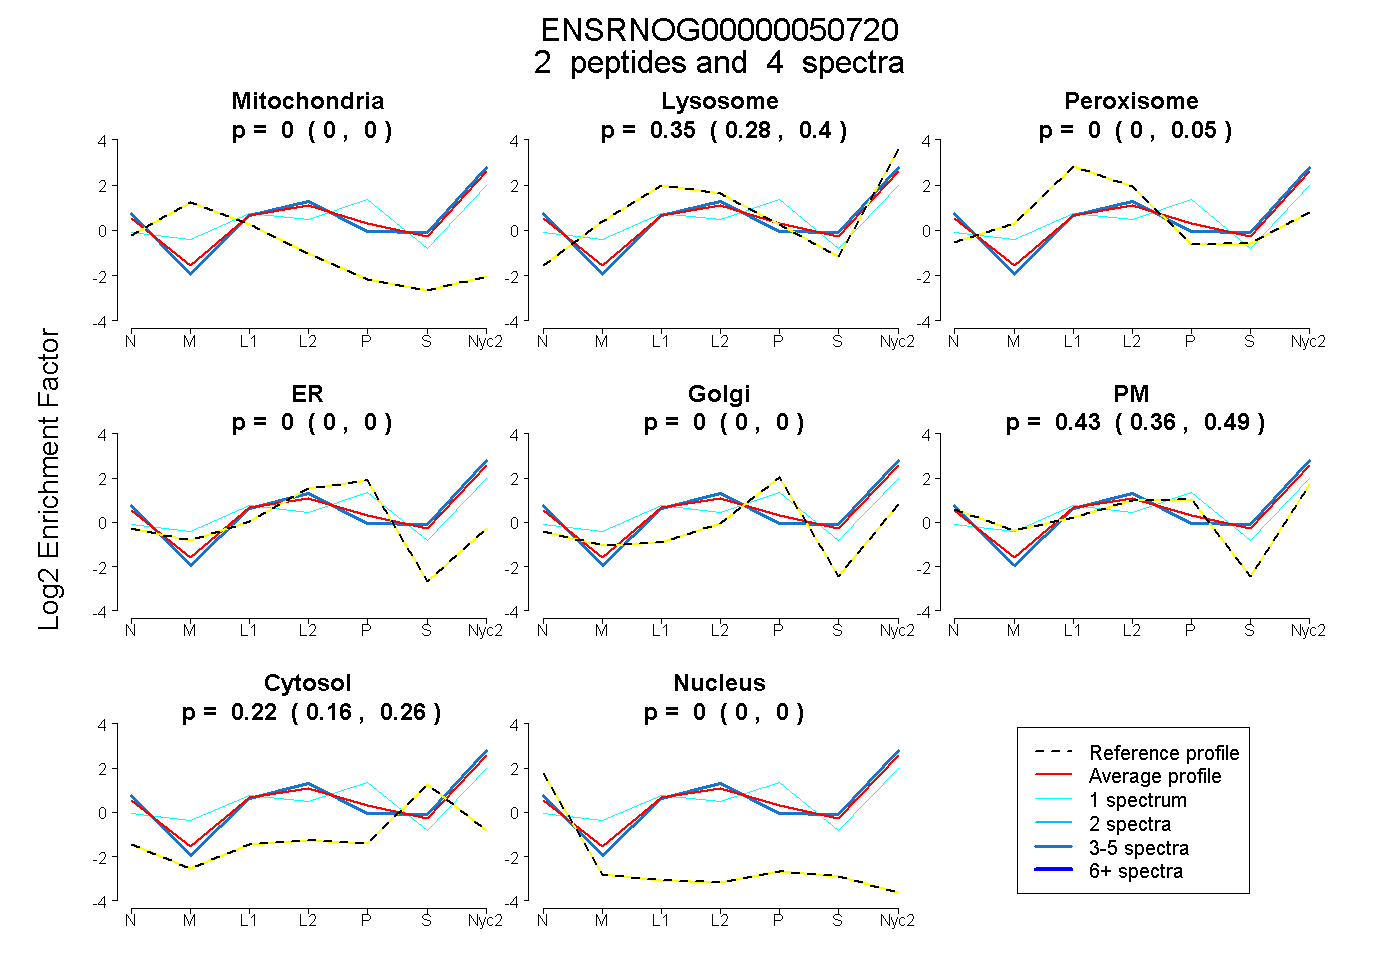
0.000 | 0.000
0.276 | 0.405
0.000 | 0.049
0.000 | 0.000
0.000 | 0.000
0.359 | 0.486
0.160 | 0.261
0.000 | 0.000
3peptides
spectra
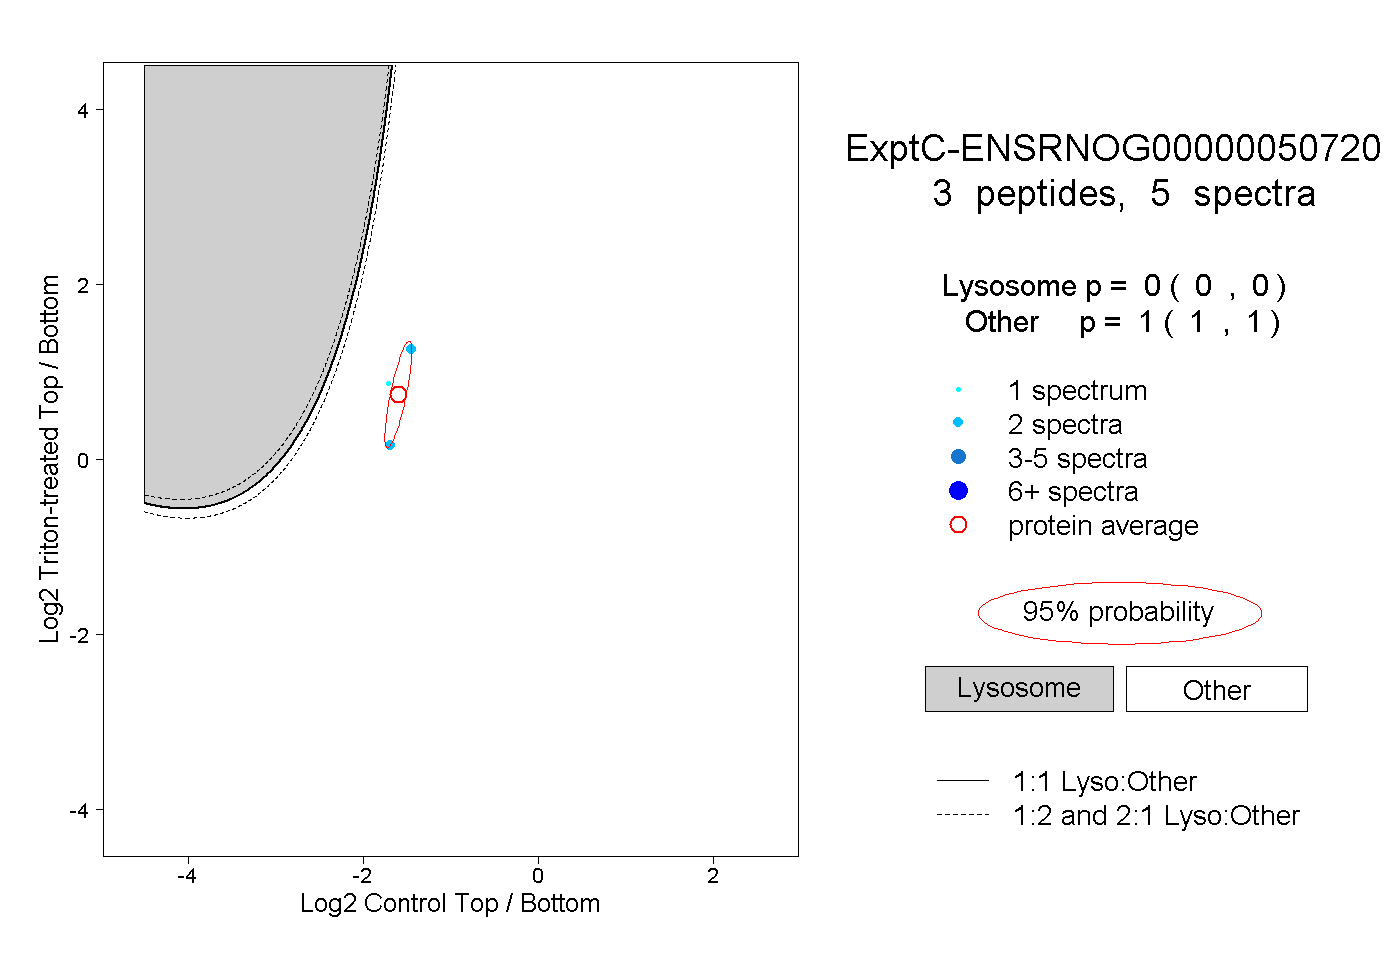
0.000 | 0.000
1.000 | 1.000
1peptide
spectra
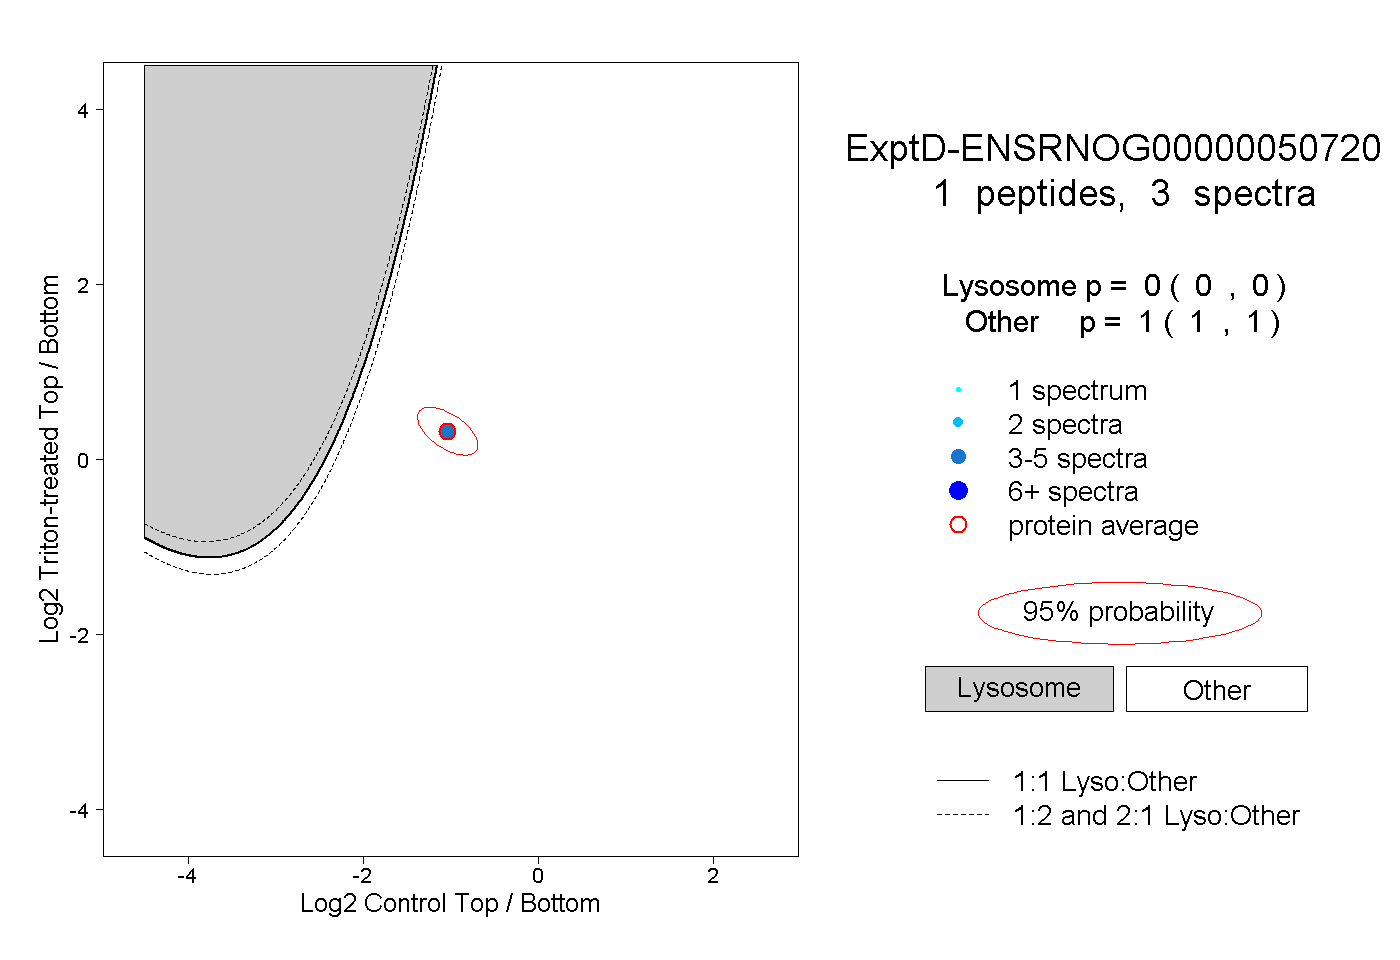
0.000 | 0.000
1.000 | 1.000