 2
2peptides
spectra
0.000 | 0.000
0.276 | 0.405
0.000 | 0.049
0.000 | 0.000
0.000 | 0.000
0.359 | 0.486
0.160 | 0.261
0.000 | 0.000
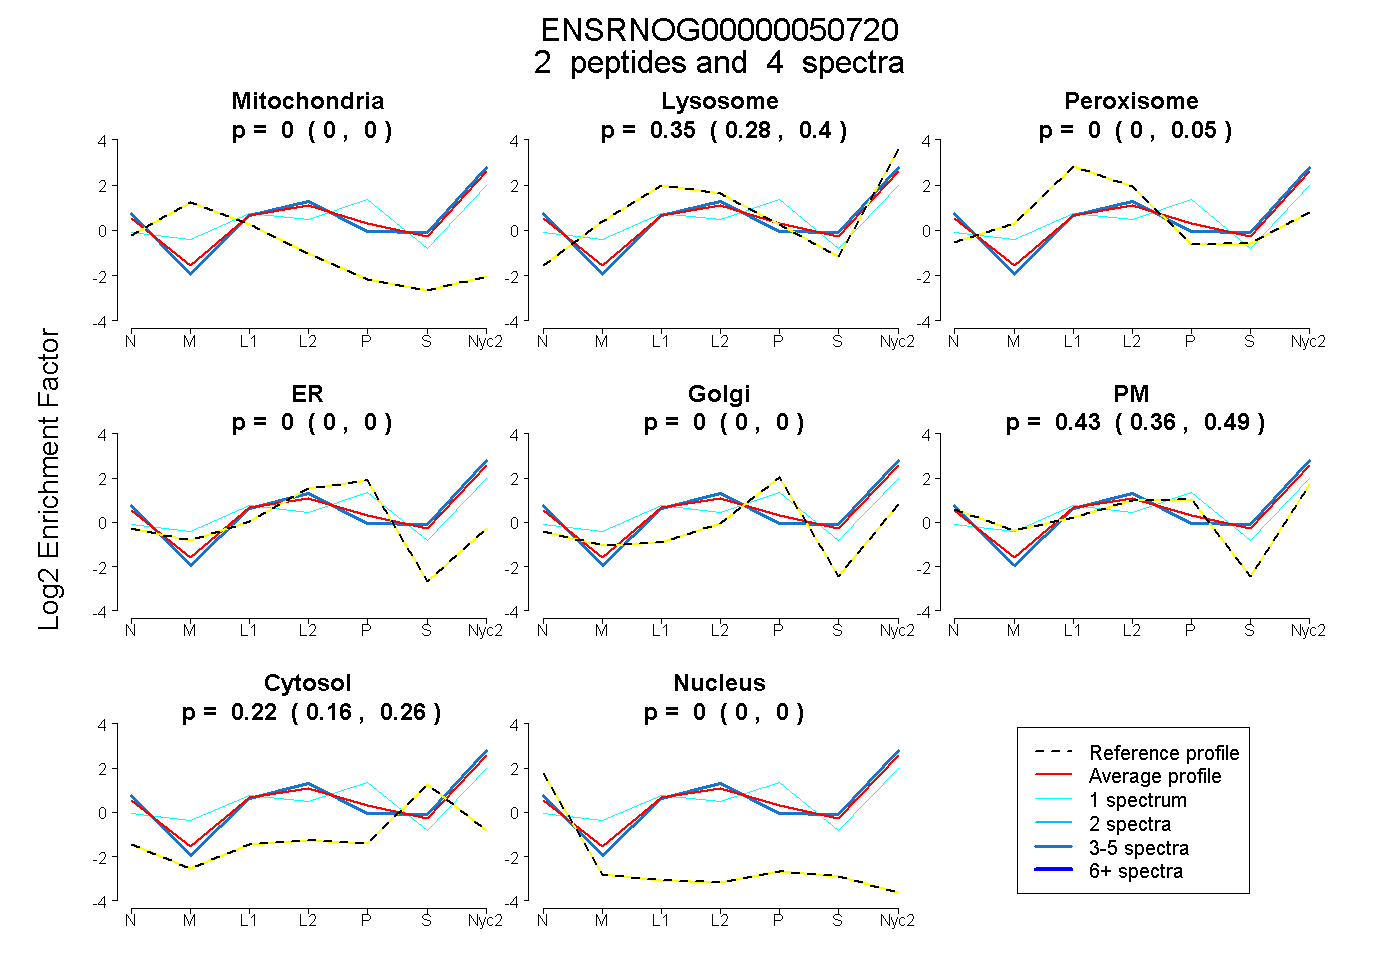
| Plot | Mito | Lyso | Perox | ER | Golgi | PM | Cytosol | Nucleus | |||||
| Expt A |
2 peptides |
4 spectra |
|
0.000 0.000 | 0.000 |
0.353 0.276 | 0.405 |
0.000 0.000 | 0.049 |
0.000 0.000 | 0.000 |
0.000 0.000 | 0.000 |
0.430 0.359 | 0.486 |
0.217 0.160 | 0.261 |
0.000 0.000 | 0.000 |
| 1 spectrum, AIYQGSFNTK | 0.000 | 0.326 | 0.053 | 0.000 | 0.238 | 0.290 | 0.092 | 0.000 | ||
| 3 spectra, EVQVSEVTENSAR | 0.000 | 0.369 | 0.000 | 0.000 | 0.000 | 0.390 | 0.241 | 0.000 |
| Plot | Lyso | Other | |||||||||||
| Expt C |
3 peptides |
5 spectra |
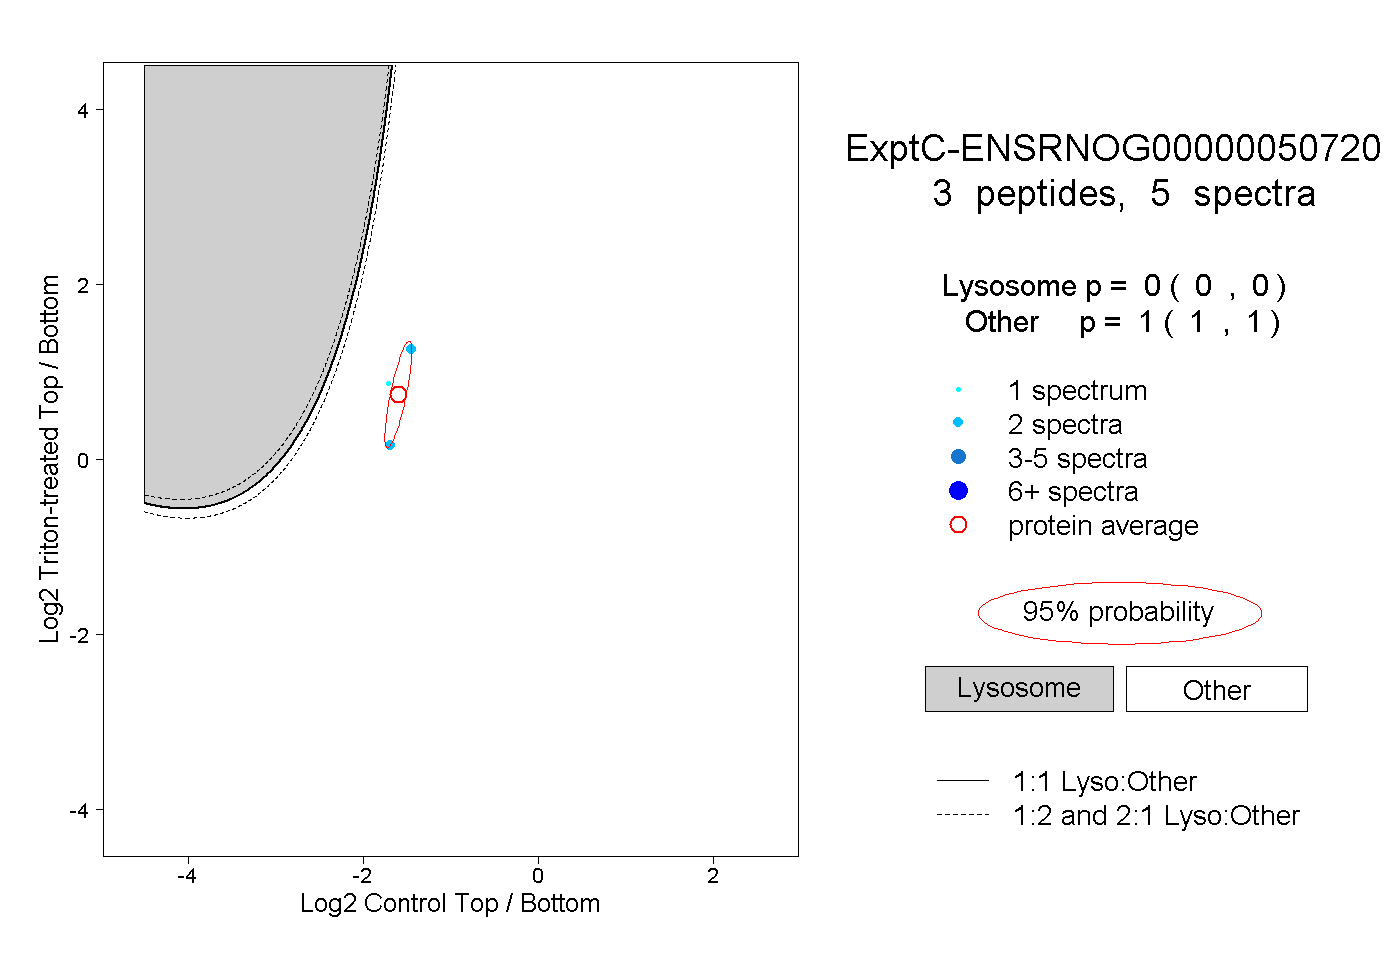 |
0.000 0.000 | 0.000 |
1.000 1.000 | 1.000 |
||||||||
| Plot | Lyso | Other | |||||||||||
| Expt D |
1 peptide |
3 spectra |
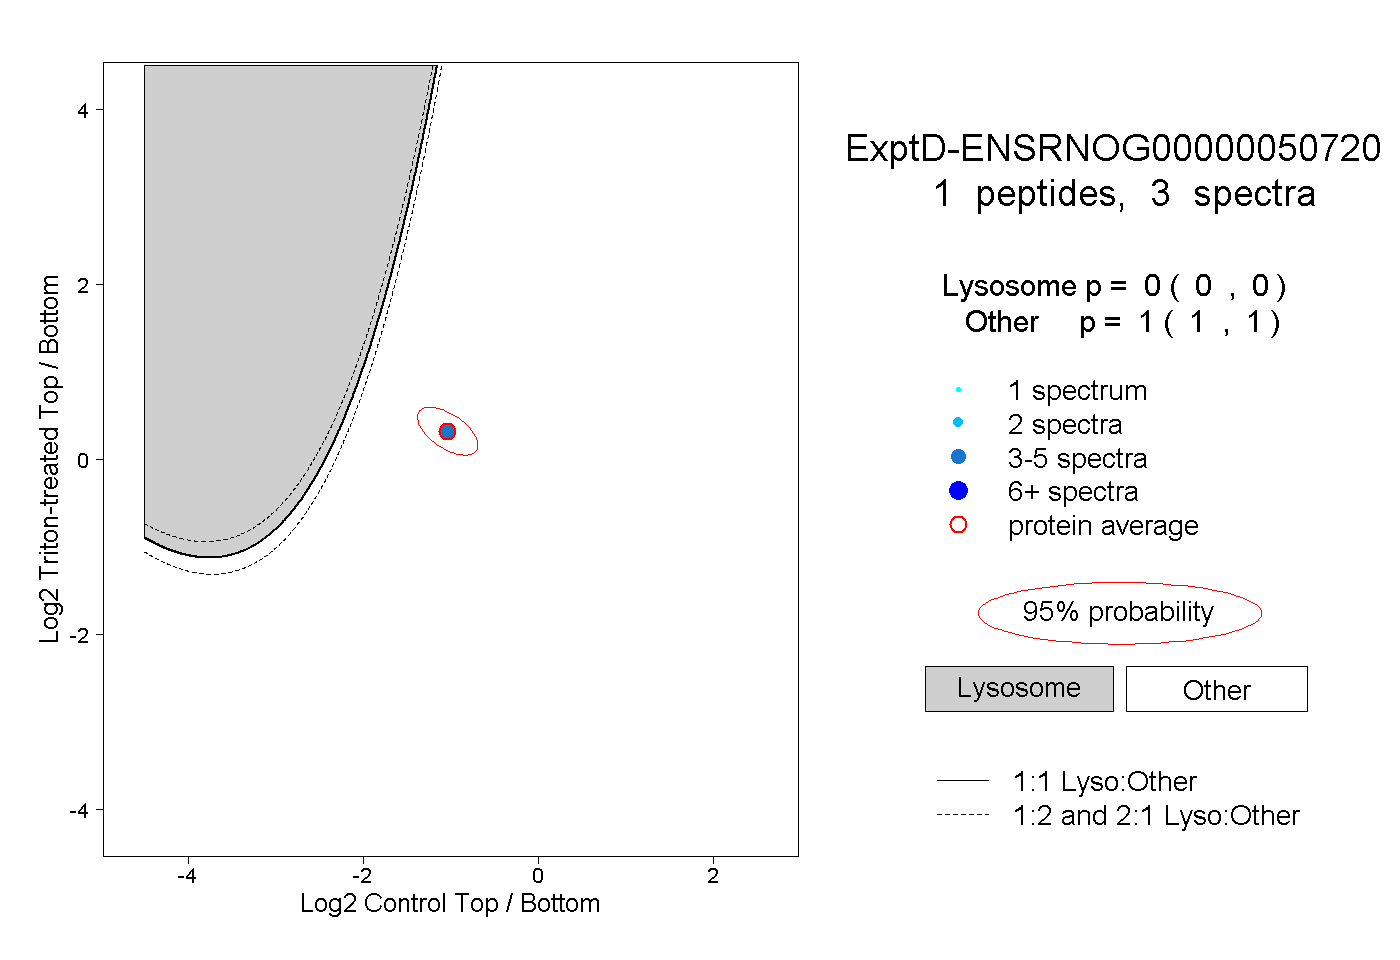 |
0.000 0.000 | 0.000 |
1.000 1.000 | 1.000 |