 13
13peptides
spectra
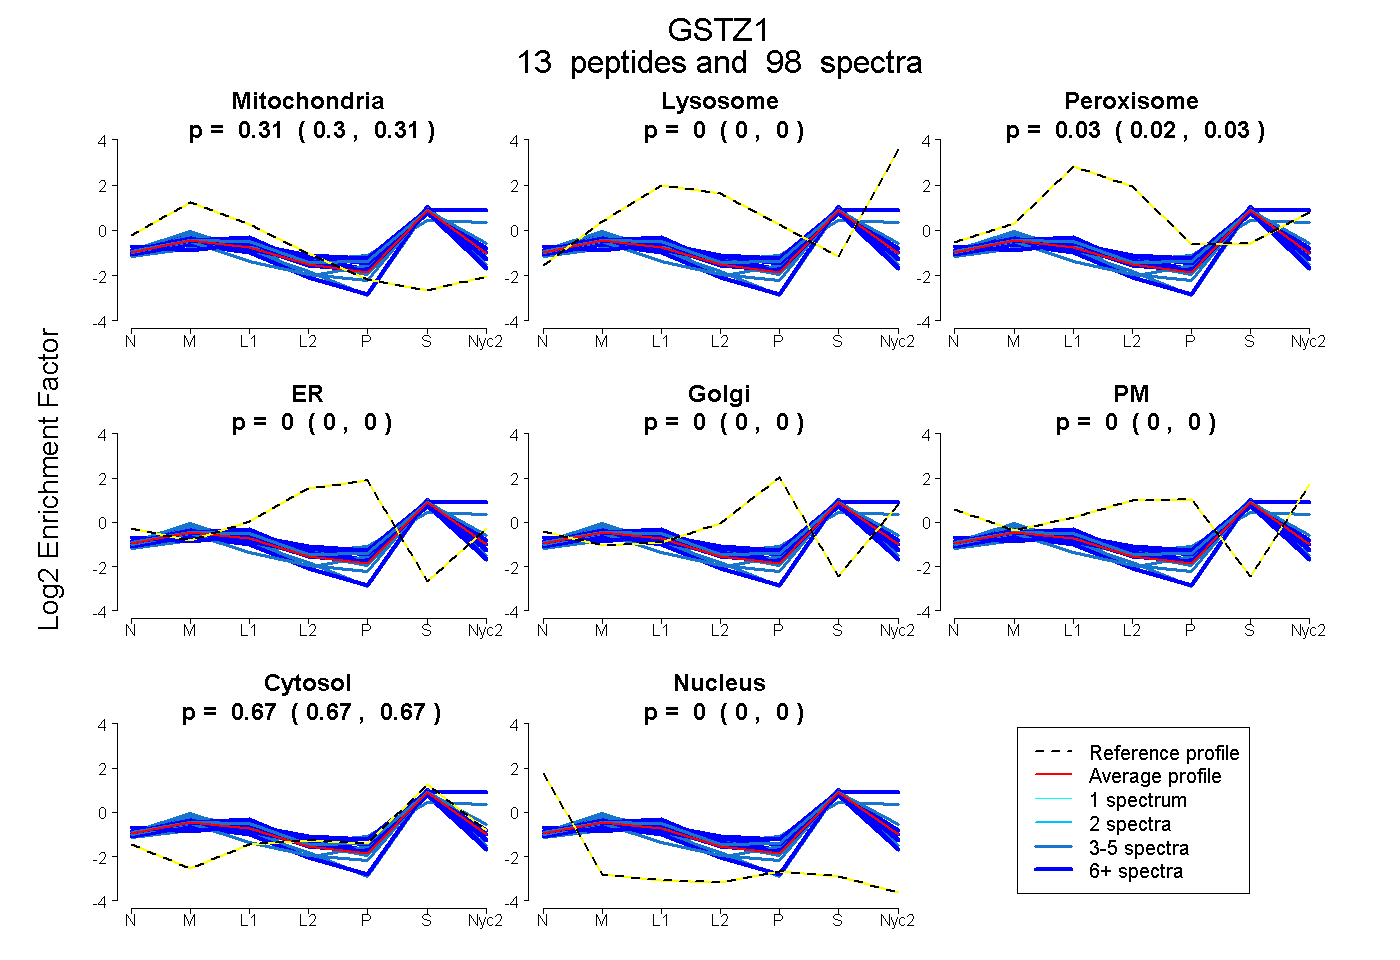
0.300 | 0.309
0.000 | 0.000
0.021 | 0.030
0.000 | 0.000
0.000 | 0.000
0.000 | 0.000
0.667 | 0.671
0.000 | 0.000
7peptides
spectra
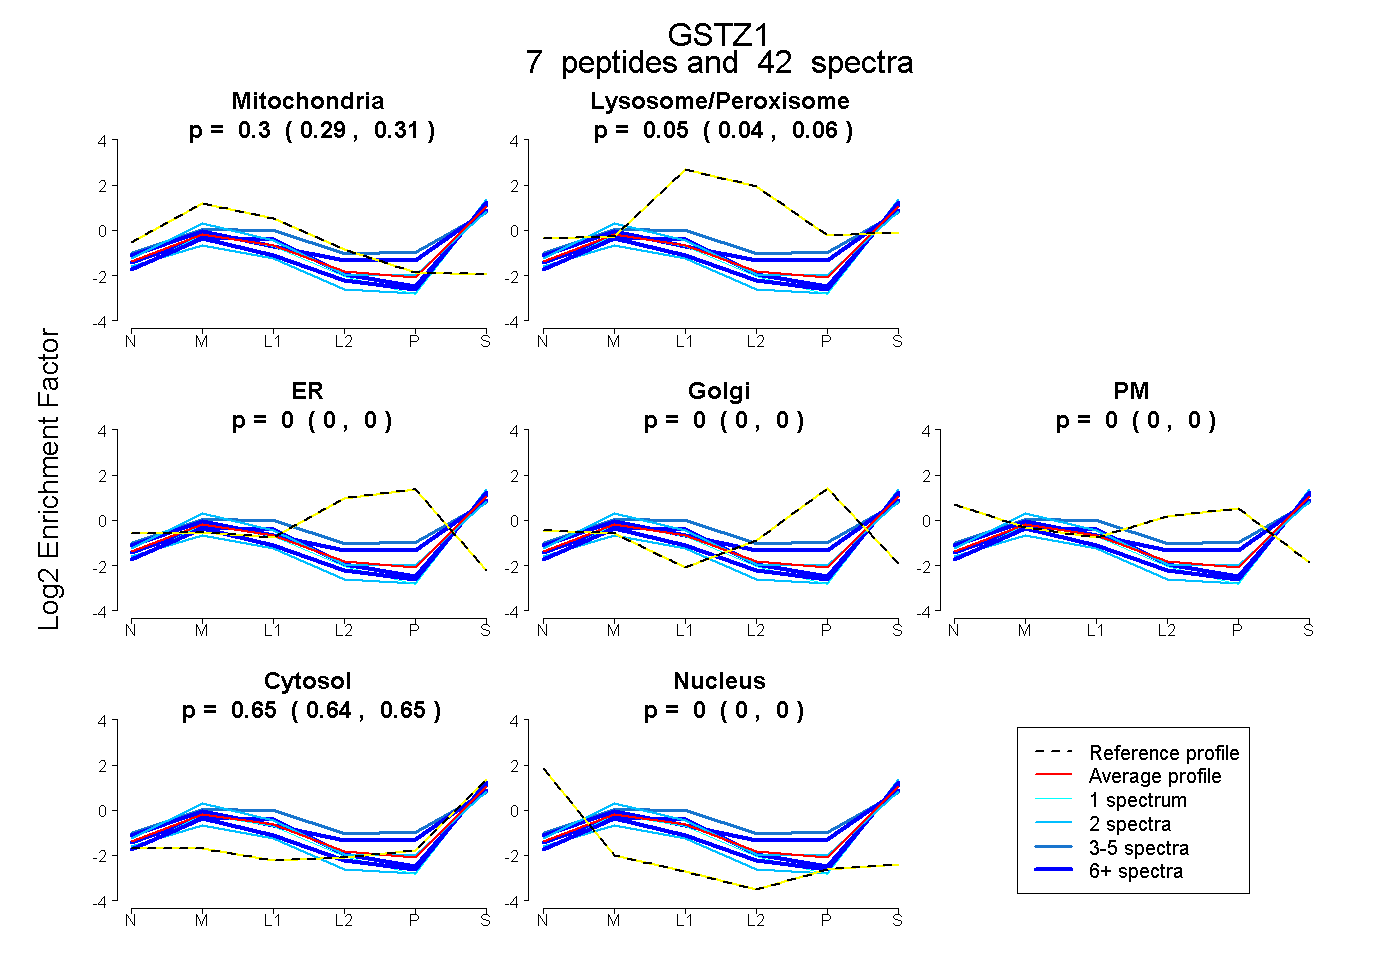
0.285 | 0.307
0.042 | 0.065
0.000 | 0.000
0.000 | 0.000
0.000 | 0.000
0.641 | 0.655
0.000 | 0.000
14peptides
spectra
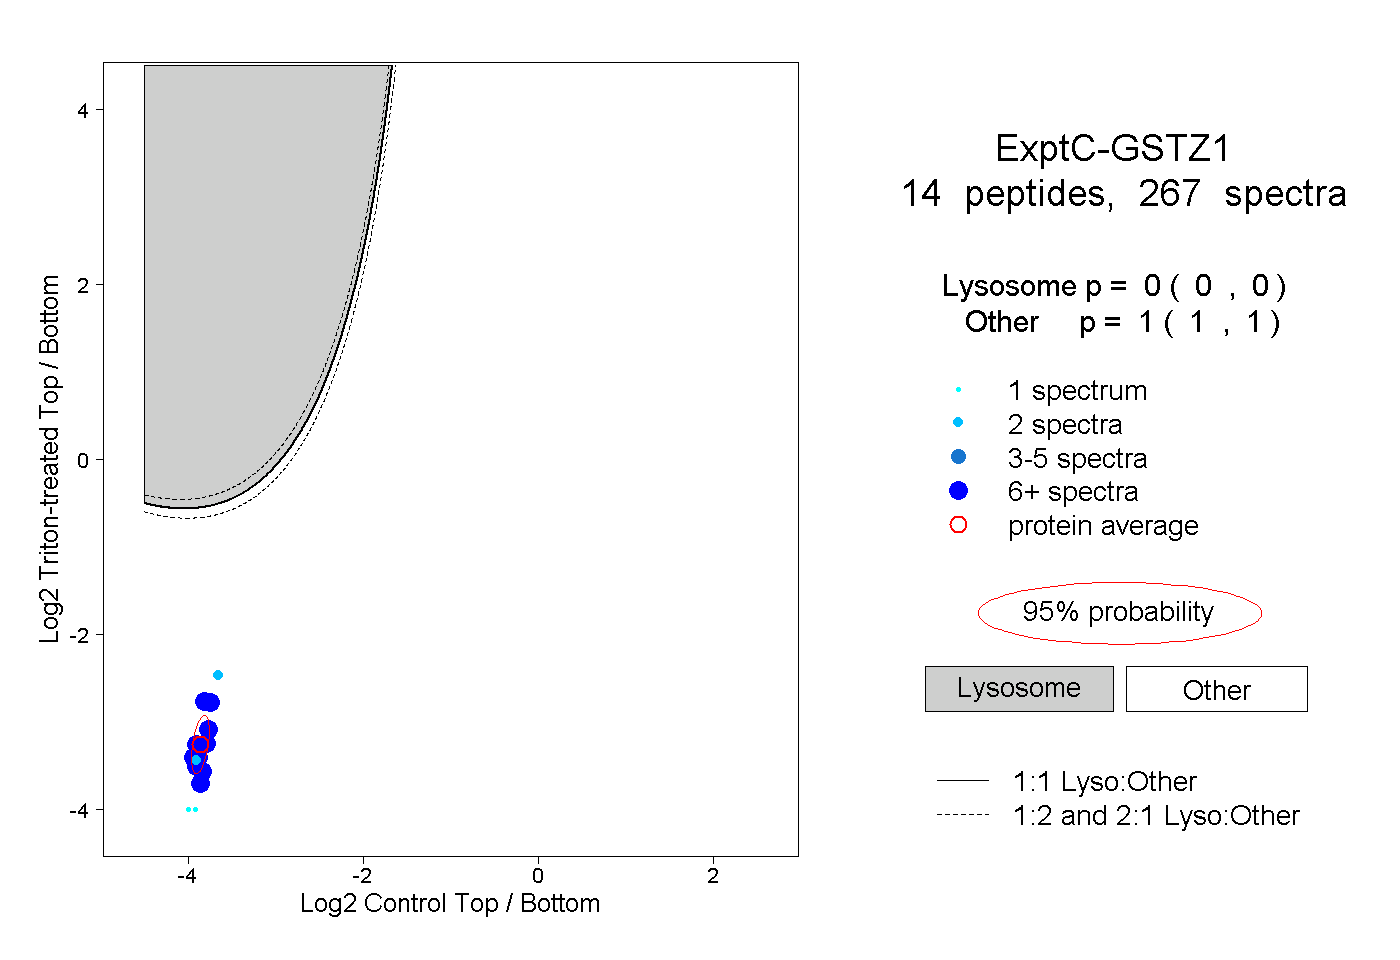
0.000 | 0.000
1.000 | 1.000
7peptides
spectra
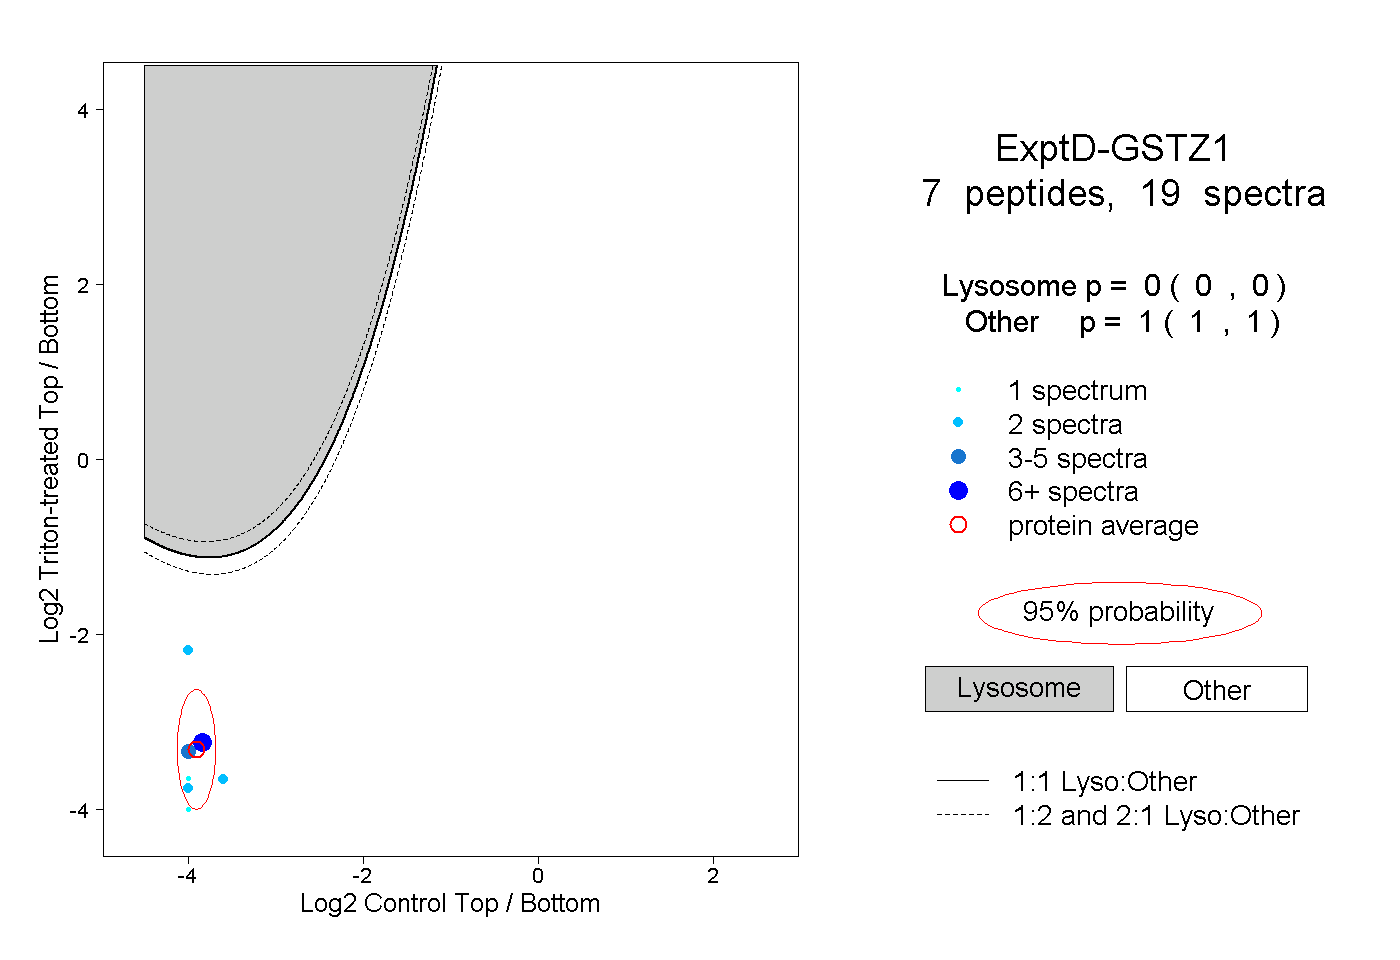
0.000 | 0.000
1.000 | 1.000