 13
13peptides
spectra
0.300 | 0.309
0.000 | 0.000
0.021 | 0.030
0.000 | 0.000
0.000 | 0.000
0.000 | 0.000
0.667 | 0.671
0.000 | 0.000
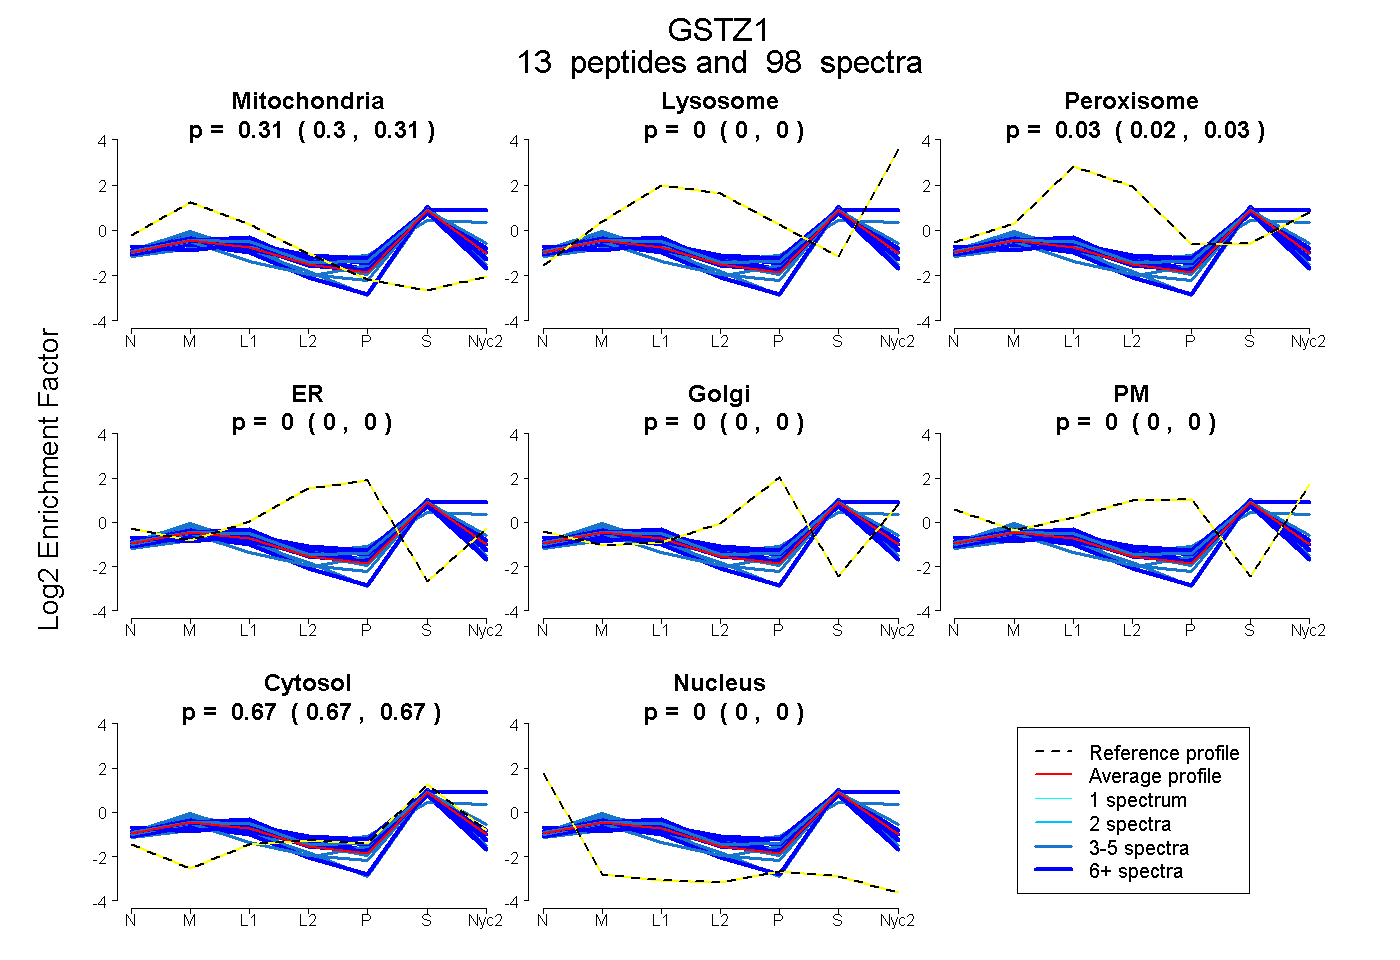
| Plot | Mito | Lyso | Perox | ER | Golgi | PM | Cytosol | Nucleus | |||||
| Expt A |
13 peptides |
98 spectra |
|
0.305 0.300 | 0.309 |
0.000 0.000 | 0.000 |
0.026 0.021 | 0.030 |
0.000 0.000 | 0.000 |
0.000 0.000 | 0.000 |
0.000 0.000 | 0.000 |
0.669 0.667 | 0.671 |
0.000 0.000 | 0.000 |
| 6 spectra, QVGQENQMPWAQK | 0.299 | 0.000 | 0.075 | 0.000 | 0.000 | 0.000 | 0.627 | 0.000 | ||
| 3 spectra, LLPQDPQK | 0.283 | 0.000 | 0.000 | 0.000 | 0.000 | 0.000 | 0.717 | 0.000 | ||
| 5 spectra, AITSGFNALEK | 0.378 | 0.000 | 0.000 | 0.000 | 0.000 | 0.000 | 0.622 | 0.000 | ||
| 3 spectra, DGGQQFSEEFQTLNPMK | 0.229 | 0.204 | 0.000 | 0.000 | 0.000 | 0.000 | 0.567 | 0.000 | ||
| 5 spectra, ILQSTAGK | 0.281 | 0.000 | 0.000 | 0.000 | 0.000 | 0.000 | 0.719 | 0.000 | ||
| 6 spectra, SSCSWR | 0.059 | 0.276 | 0.000 | 0.000 | 0.000 | 0.000 | 0.665 | 0.000 | ||
| 9 spectra, QVPALK | 0.284 | 0.000 | 0.086 | 0.000 | 0.000 | 0.000 | 0.630 | 0.000 | ||
| 8 spectra, GIDYEIVPINLIK | 0.297 | 0.000 | 0.009 | 0.000 | 0.000 | 0.000 | 0.693 | 0.000 | ||
| 3 spectra, IDGITIGQSLAILEYLEETRPIPR | 0.357 | 0.000 | 0.000 | 0.000 | 0.000 | 0.000 | 0.643 | 0.000 | ||
| 3 spectra, VDLSPYPTISHINK | 0.241 | 0.072 | 0.045 | 0.000 | 0.000 | 0.000 | 0.643 | 0.000 | ||
| 16 spectra, LALALK | 0.308 | 0.000 | 0.000 | 0.000 | 0.000 | 0.000 | 0.688 | 0.004 | ||
| 10 spectra, QPDTPAELR | 0.294 | 0.024 | 0.025 | 0.000 | 0.000 | 0.000 | 0.657 | 0.000 | ||
| 21 spectra, ALLALEAFQVSHPCR | 0.377 | 0.000 | 0.010 | 0.000 | 0.000 | 0.000 | 0.614 | 0.000 |
| Plot | Mito | Lyso or Perox | ER | Golgi | PM | Cytosol | Nucleus | ||||||
| Expt B |
7 peptides |
42 spectra |
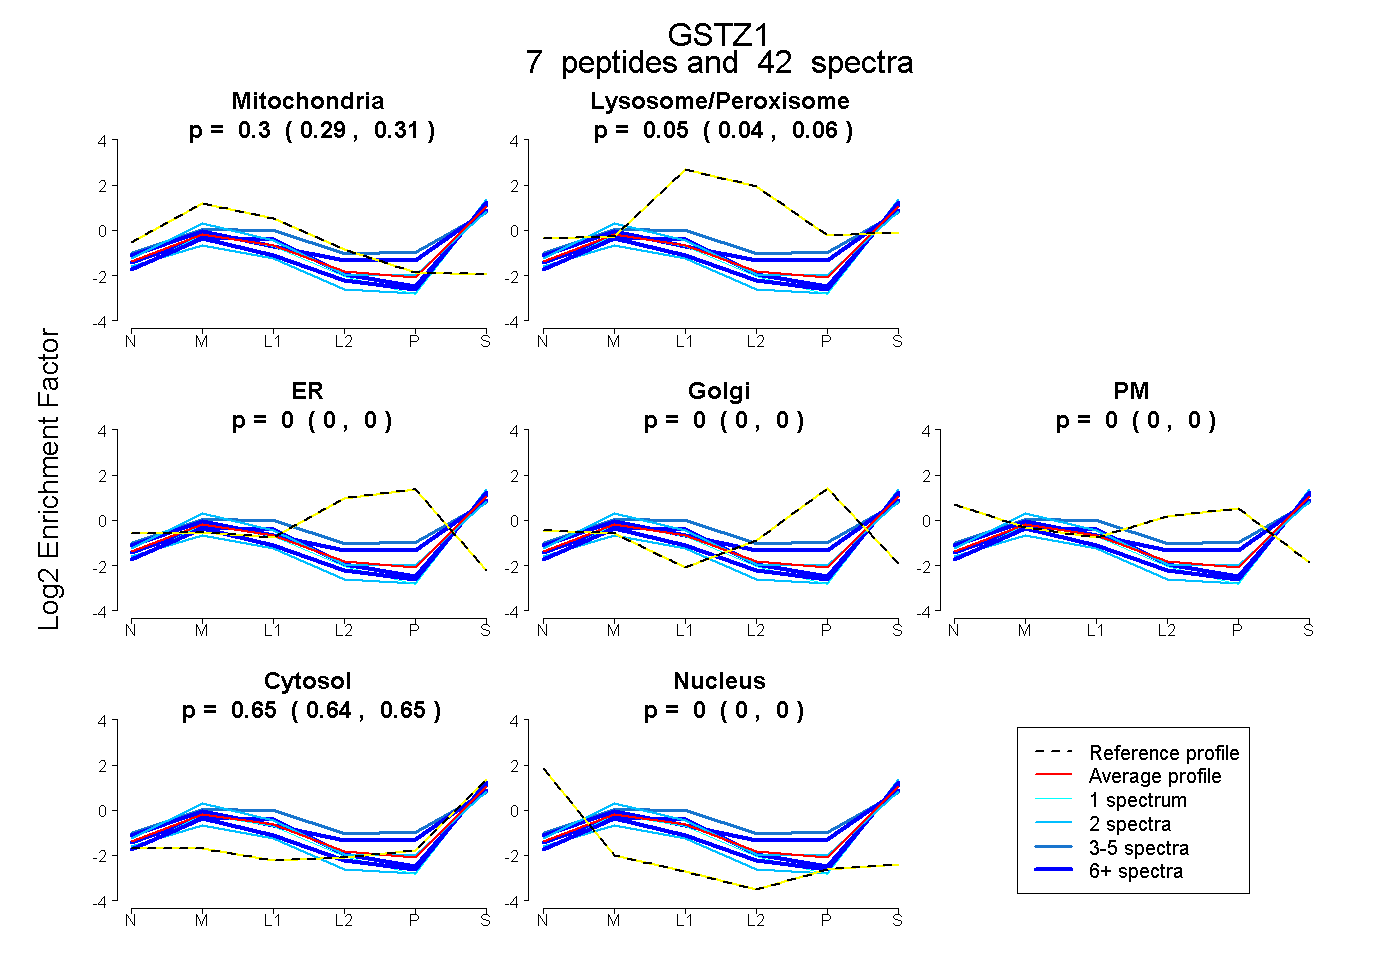 |
0.297 0.285 | 0.307 |
0.055 0.042 | 0.065 |
0.000 0.000 | 0.000 |
0.000 0.000 | 0.000 |
0.000 0.000 | 0.000 |
0.649 0.641 | 0.655 |
0.000 0.000 | 0.000 |
|||
| Plot | Lyso | Other | |||||||||||
| Expt C |
14 peptides |
267 spectra |
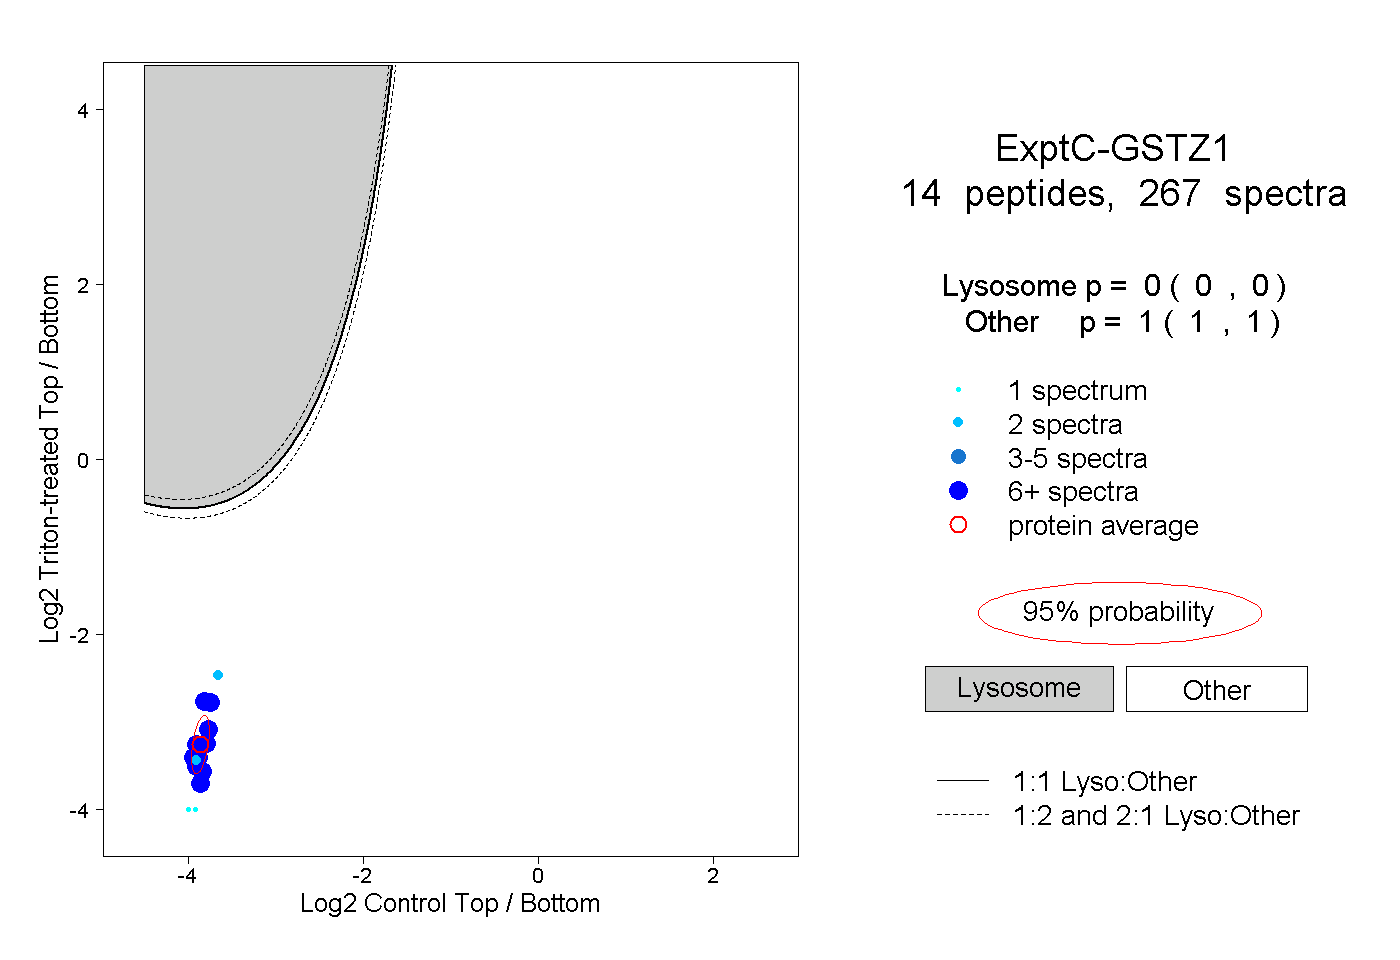 |
0.000 0.000 | 0.000 |
1.000 1.000 | 1.000 |
||||||||
| Plot | Lyso | Other | |||||||||||
| Expt D |
7 peptides |
19 spectra |
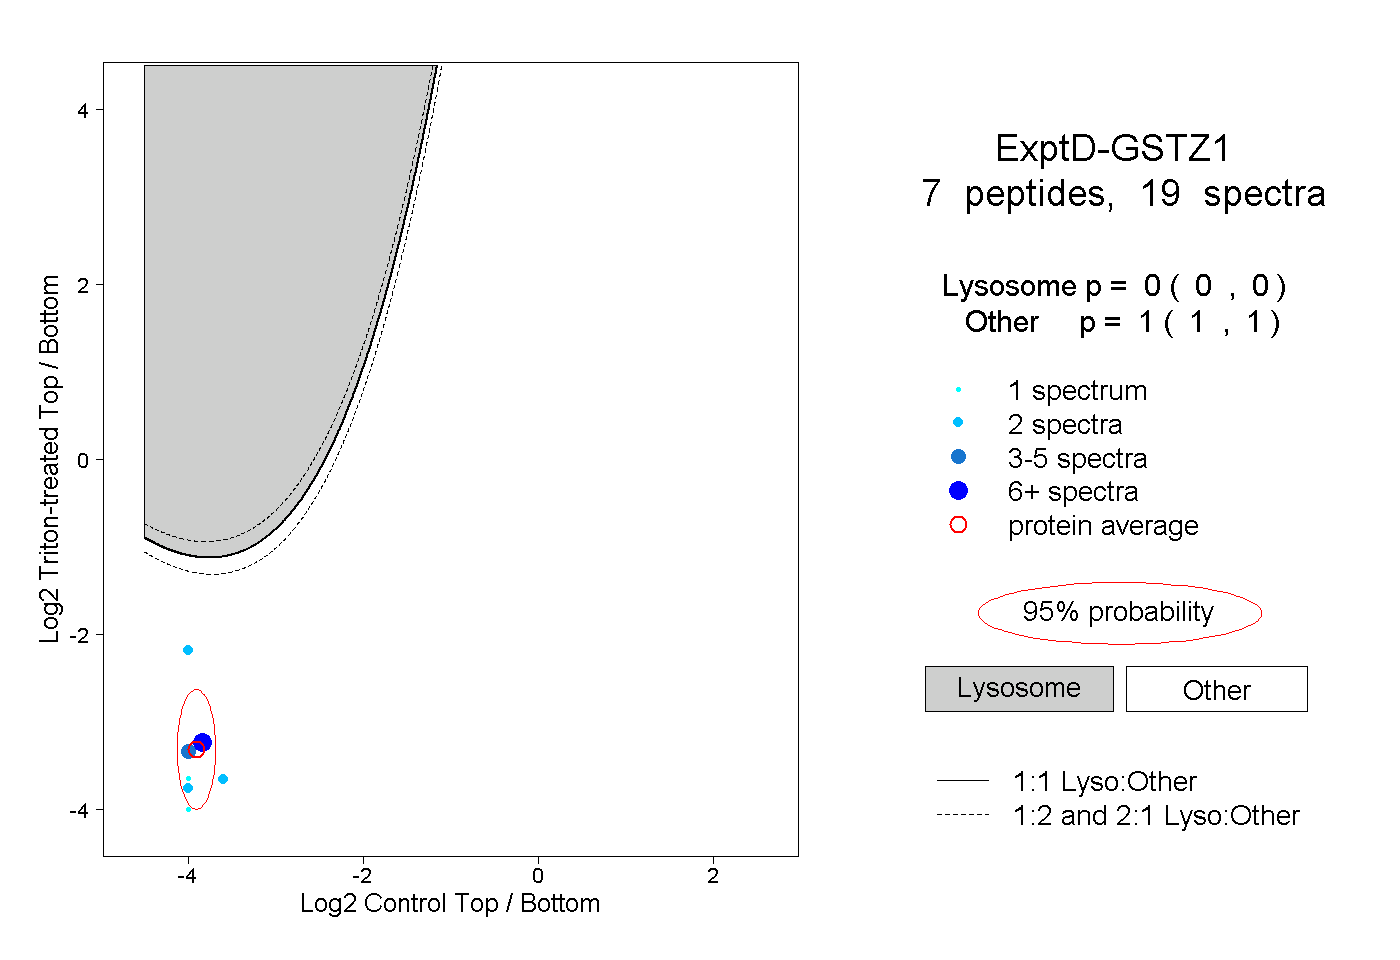 |
0.000 0.000 | 0.000 |
1.000 1.000 | 1.000 |