 3
3peptides
spectra
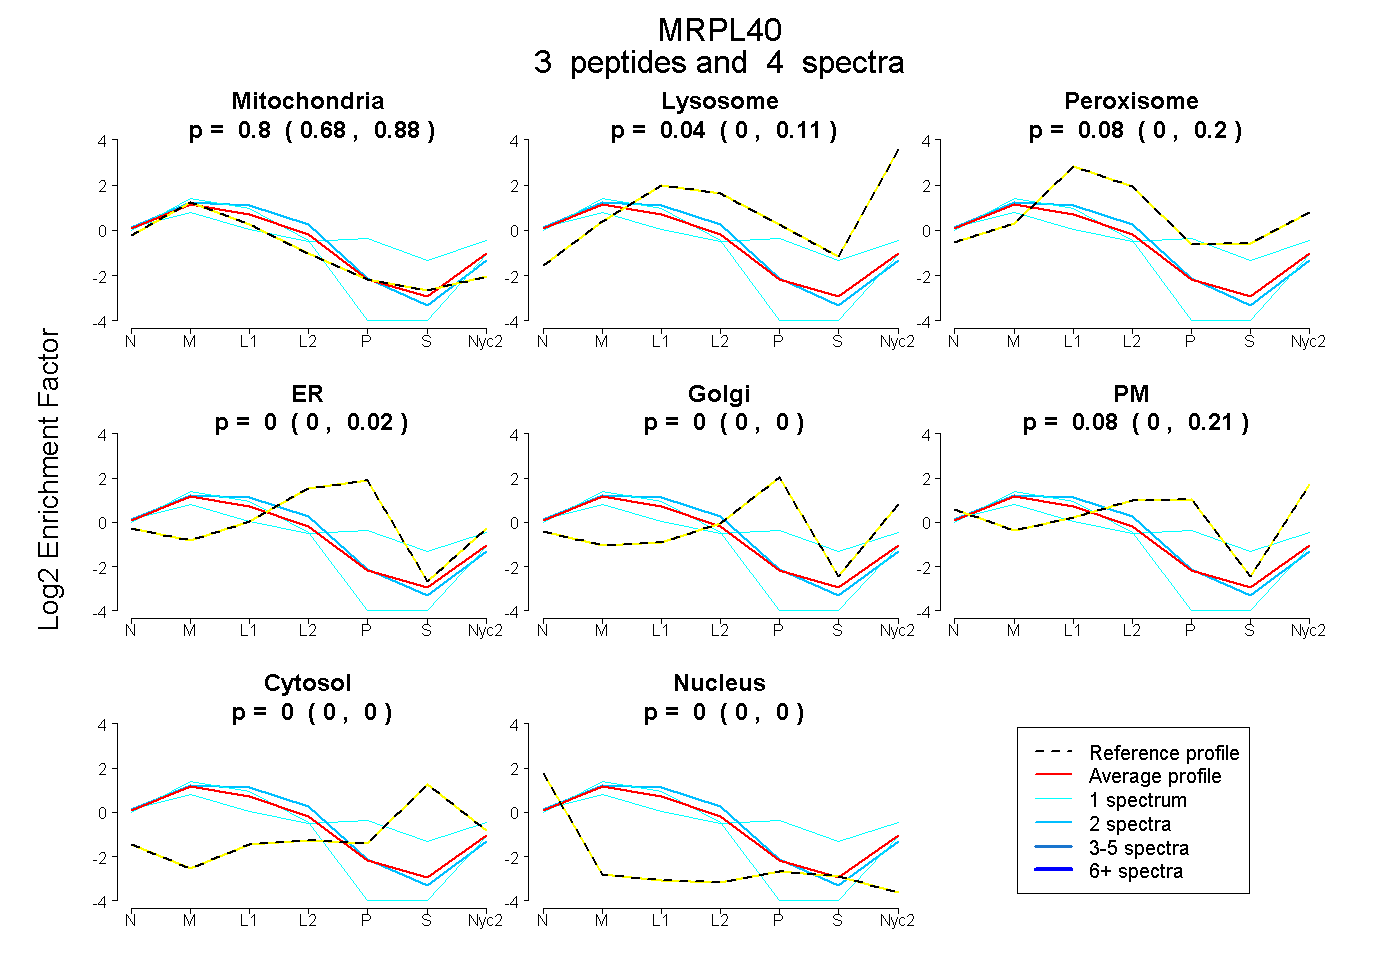
0.678 | 0.879
0.000 | 0.105
0.000 | 0.196
0.000 | 0.019
0.000 | 0.000
0.000 | 0.208
0.000 | 0.000
0.000 | 0.000
4peptides
spectra
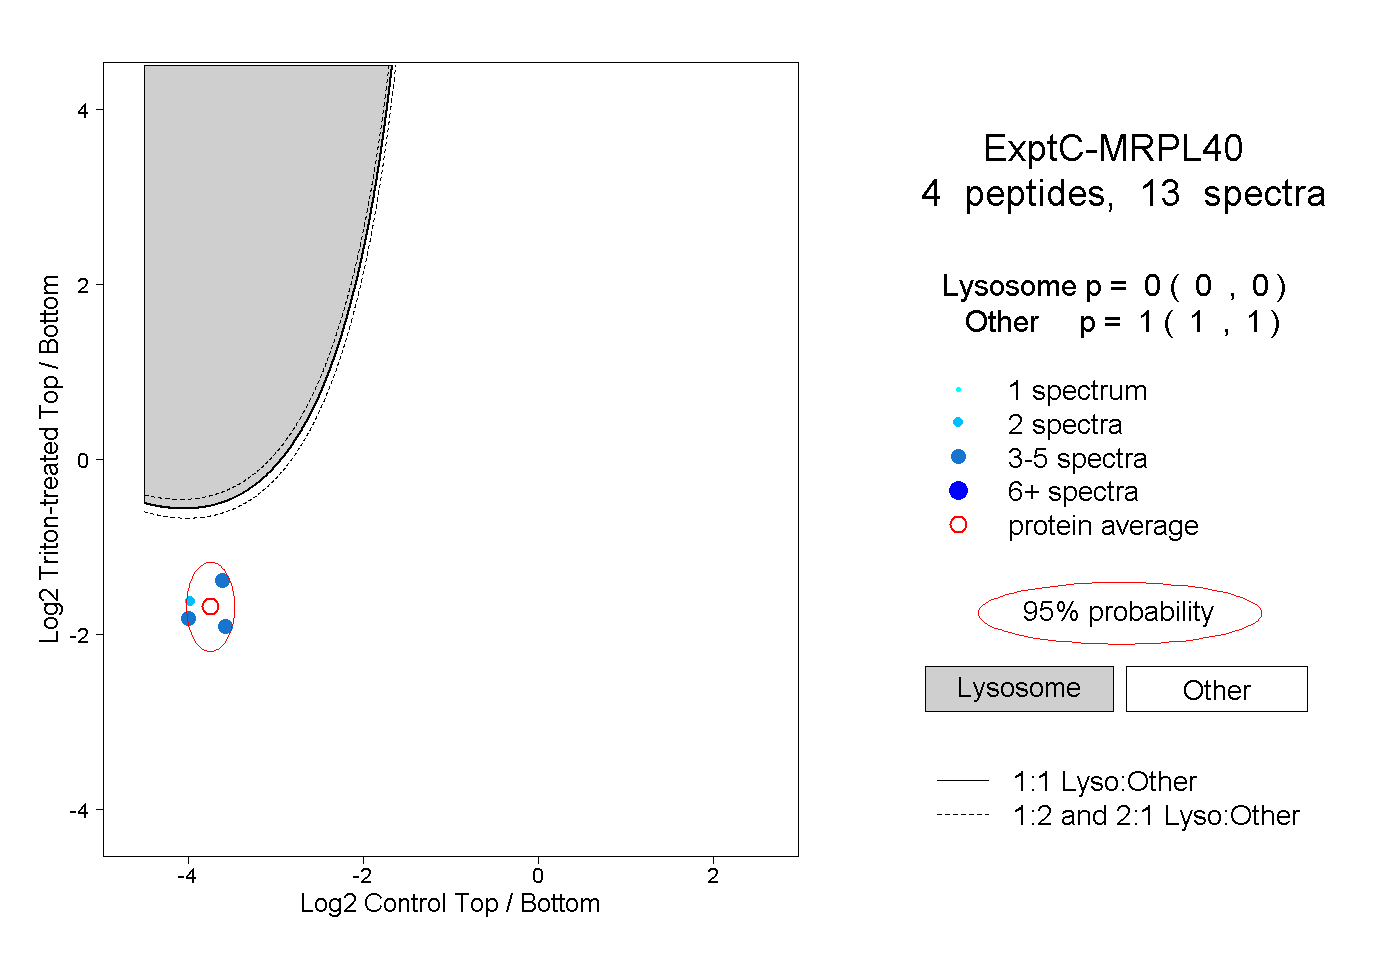
0.000 | 0.000
1.000 | 1.000
1peptide
spectra
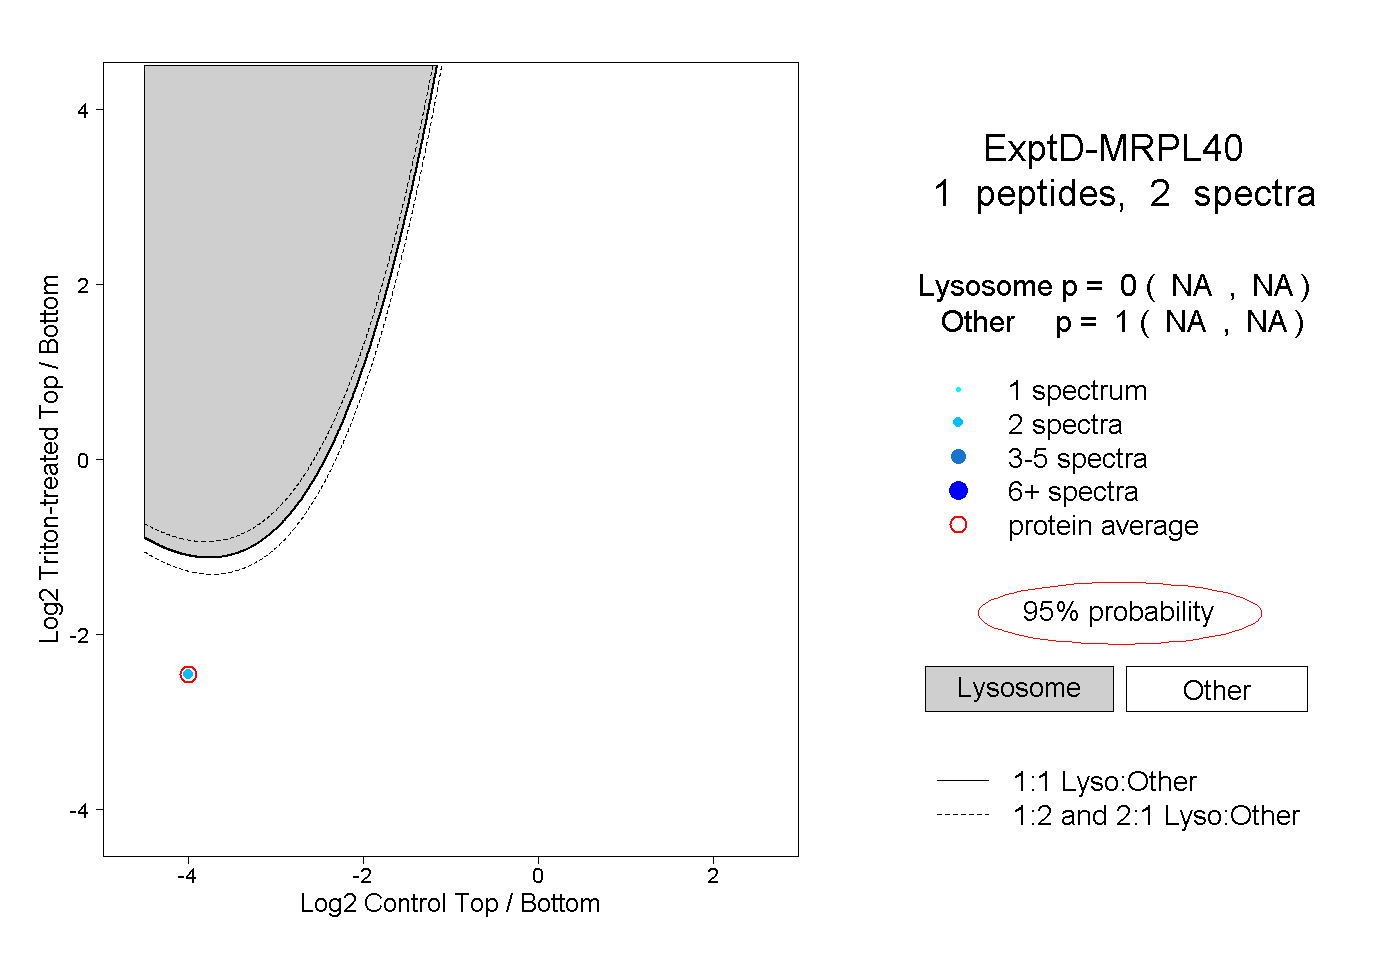
NA | NA
NA | NA