 3
3peptides
spectra
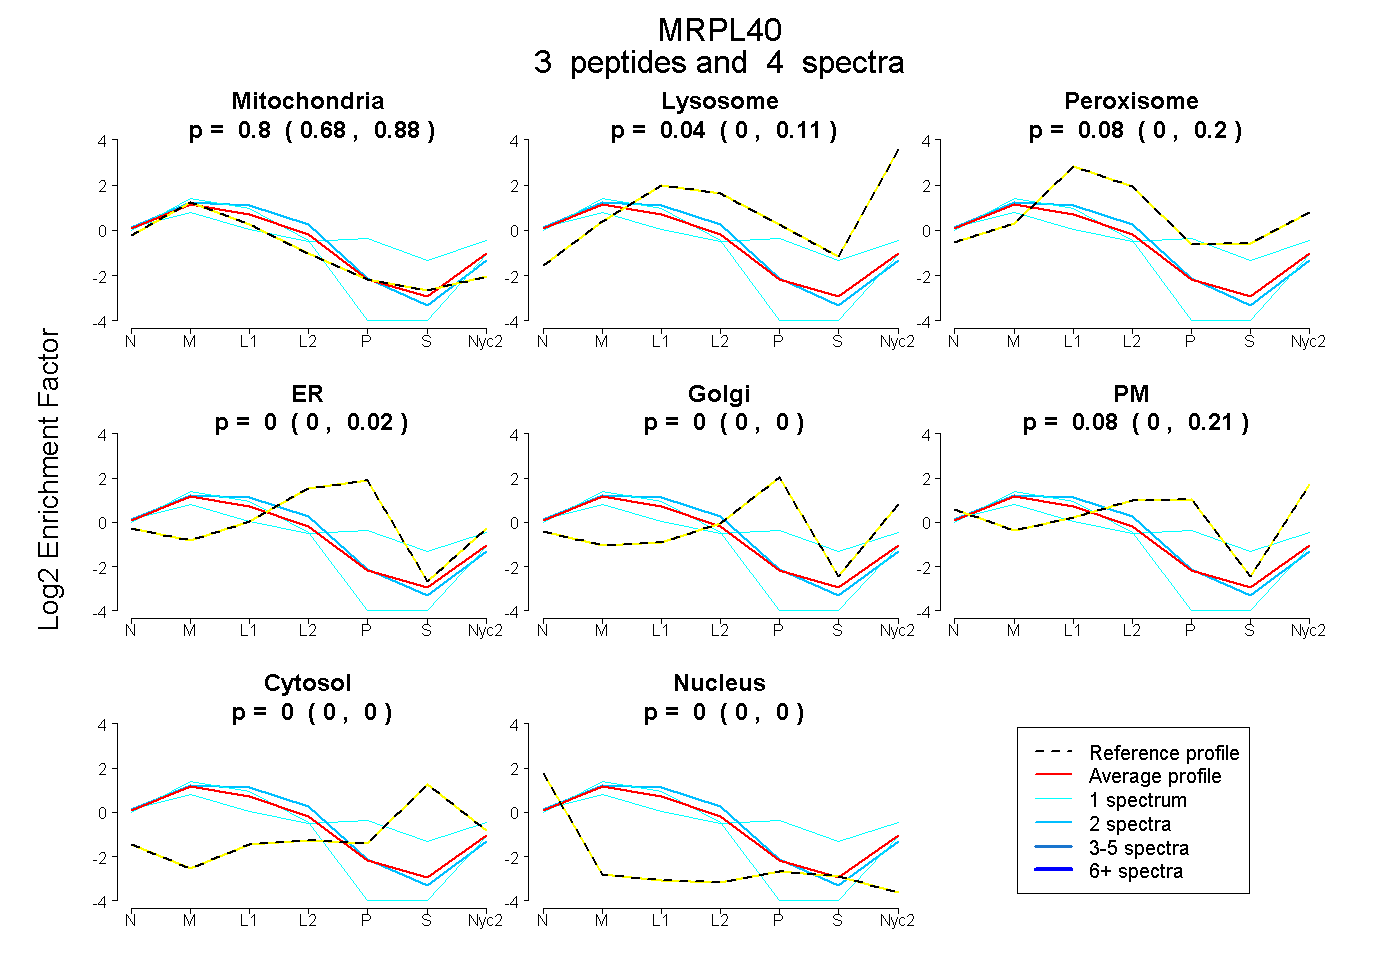
0.678 | 0.879
0.000 | 0.105
0.000 | 0.196
0.000 | 0.019
0.000 | 0.000
0.000 | 0.208
0.000 | 0.000
0.000 | 0.000
| Plot | Mito | Lyso | Perox | ER | Golgi | PM | Cytosol | Nucleus | |||||
| Expt A |
3 peptides |
4 spectra |
|
0.799 0.678 | 0.879 |
0.038 0.000 | 0.105 |
0.085 0.000 | 0.196 |
0.000 0.000 | 0.019 |
0.000 0.000 | 0.000 |
0.079 0.000 | 0.208 |
0.000 0.000 | 0.000 |
0.000 0.000 | 0.000 |
| 1 spectrum, QRPQEEHSFEESER | 0.977 | 0.023 | 0.000 | 0.000 | 0.000 | 0.000 | 0.000 | 0.000 | ||
| 2 spectra, QQEHEMER | 0.775 | 0.000 | 0.182 | 0.000 | 0.000 | 0.043 | 0.000 | 0.000 | ||
| 1 spectrum, DTSLFPFEK | 0.453 | 0.000 | 0.093 | 0.000 | 0.109 | 0.231 | 0.114 | 0.000 |
| Plot | Lyso | Other | |||||||||||
| Expt C |
4 peptides |
13 spectra |
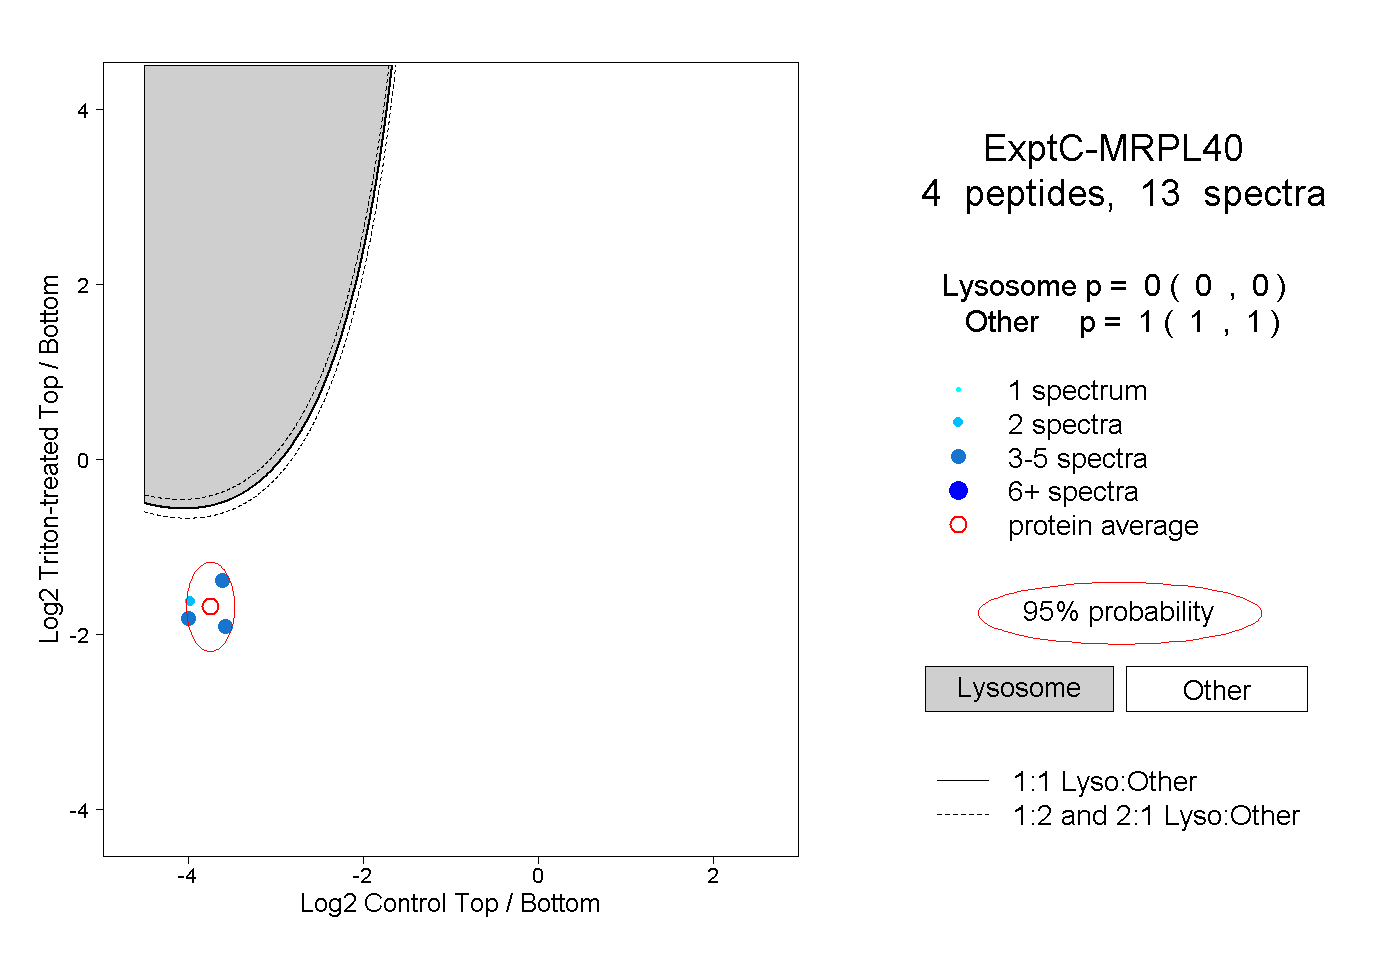 |
0.000 0.000 | 0.000 |
1.000 1.000 | 1.000 |
||||||||
| Plot | Lyso | Other | |||||||||||
| Expt D |
1 peptide |
2 spectra |
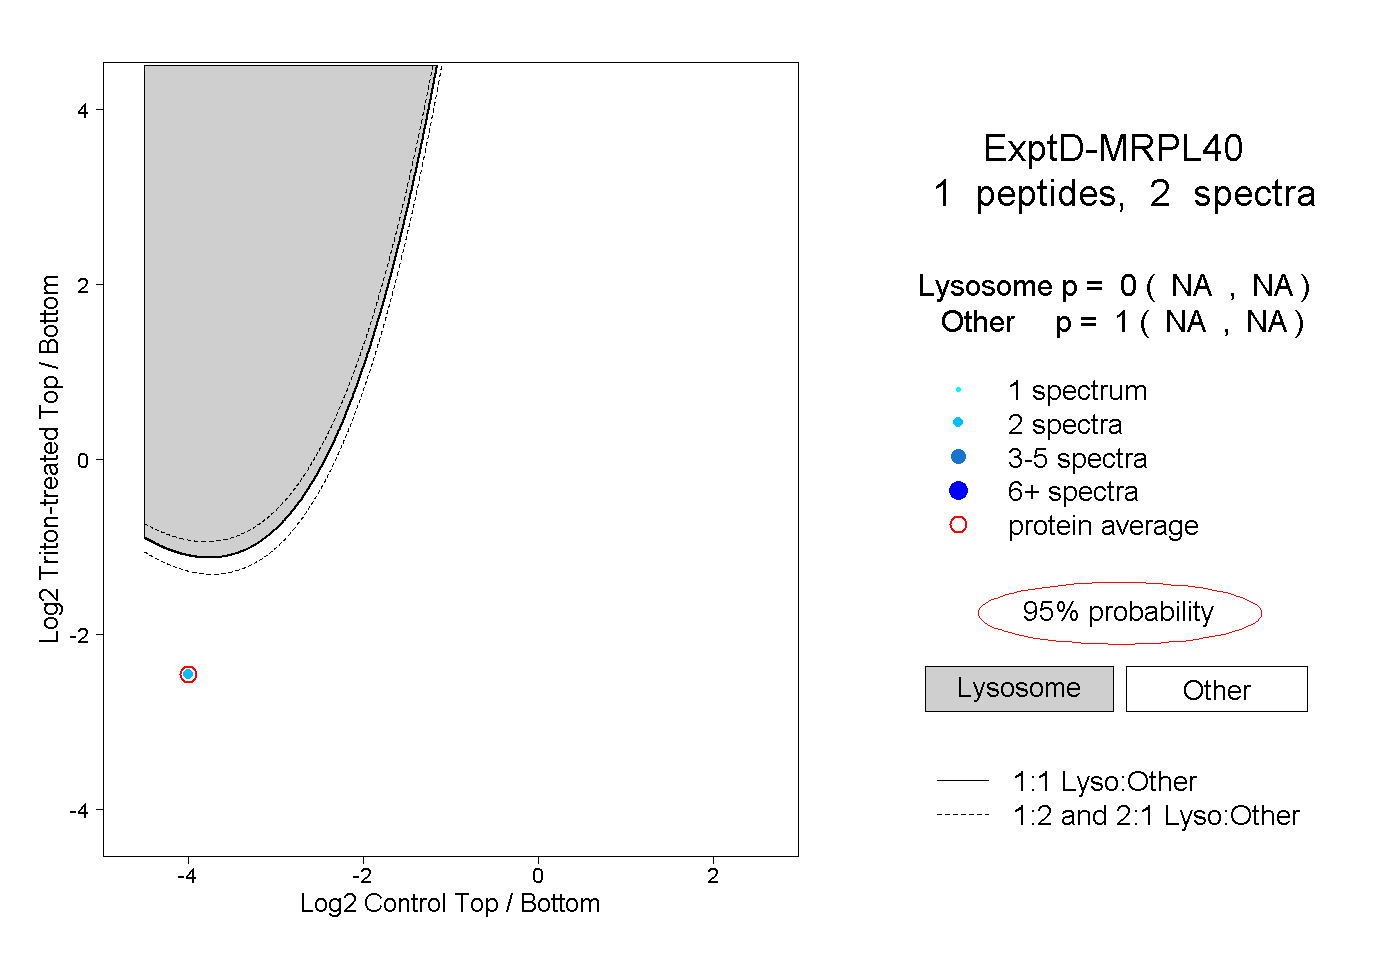 |
0.000 NA | NA |
1.000 NA | NA |