 7
7peptides
spectra
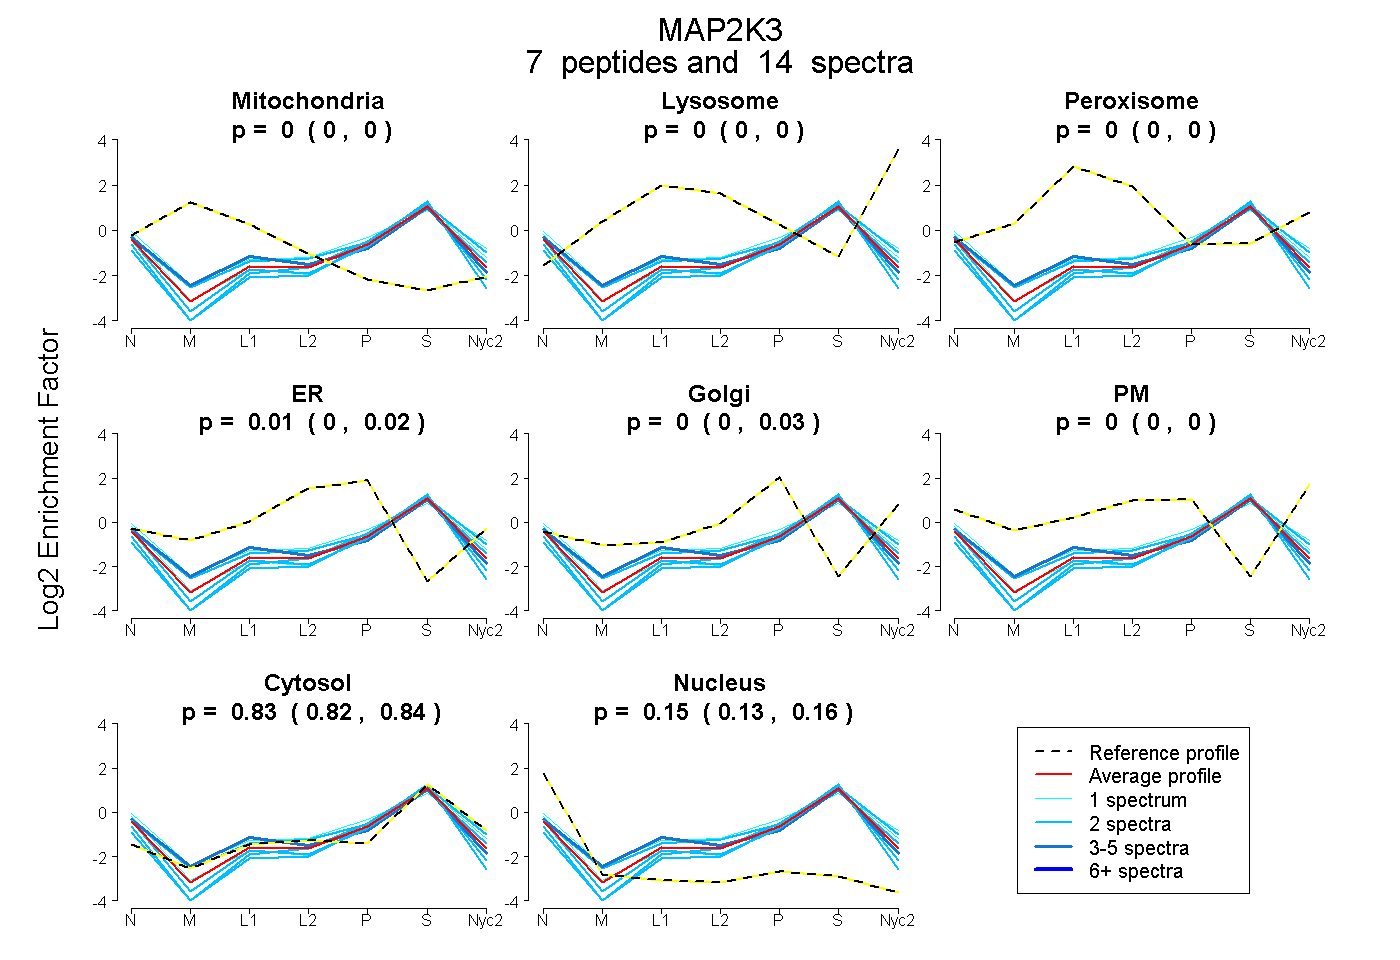
0.000 | 0.000
0.000 | 0.000
0.000 | 0.000
0.000 | 0.024
0.000 | 0.027
0.000 | 0.000
0.825 | 0.841
0.135 | 0.155
1peptide
spectra
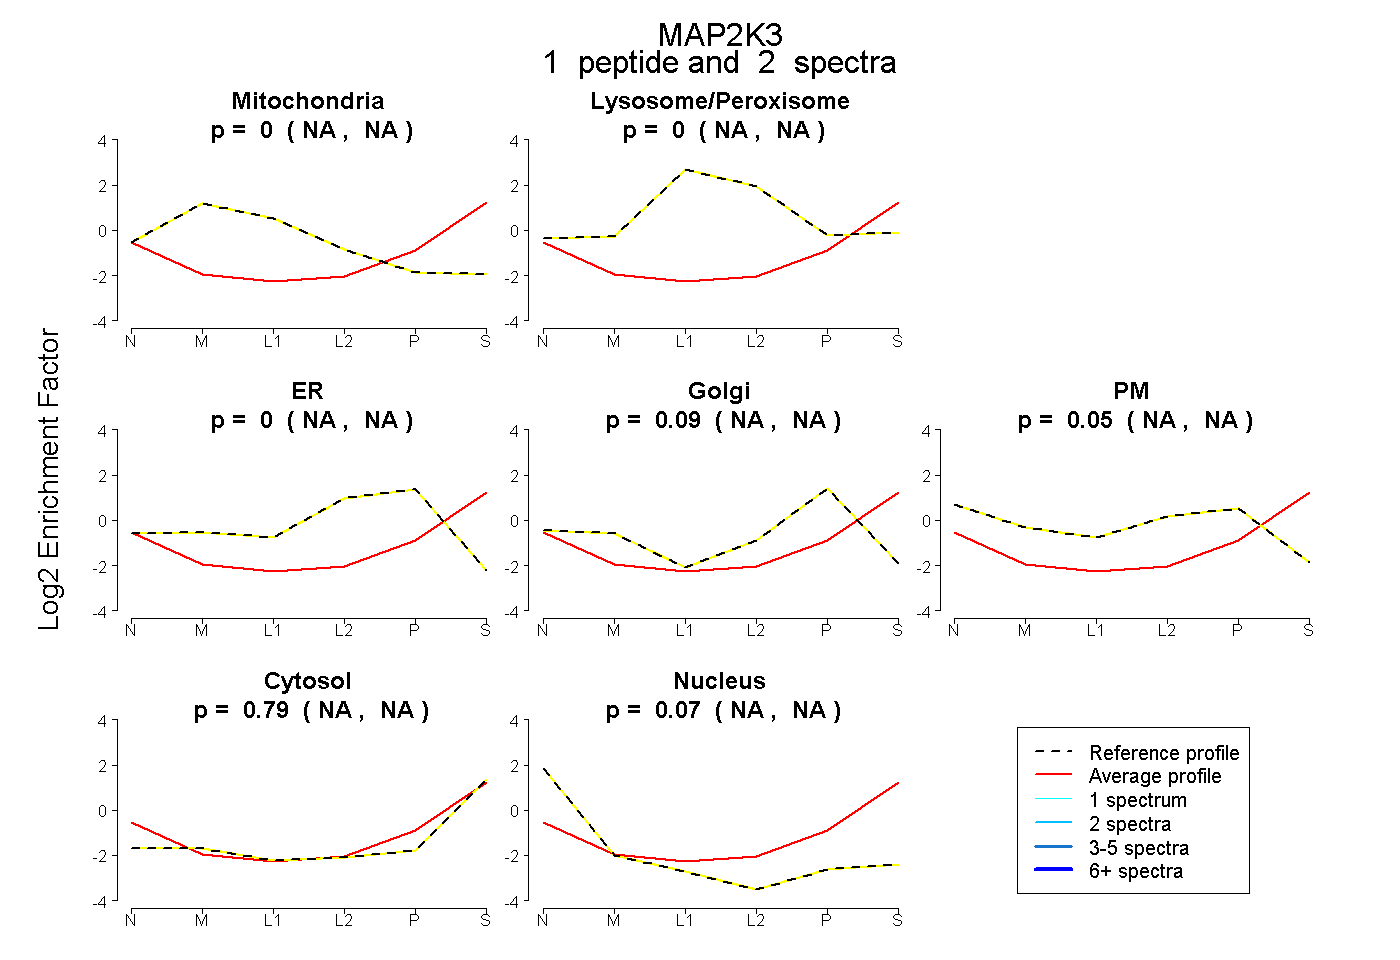
NA | NA
NA | NA
NA | NA
NA | NA
NA | NA
NA | NA
NA | NA
1peptide
spectra
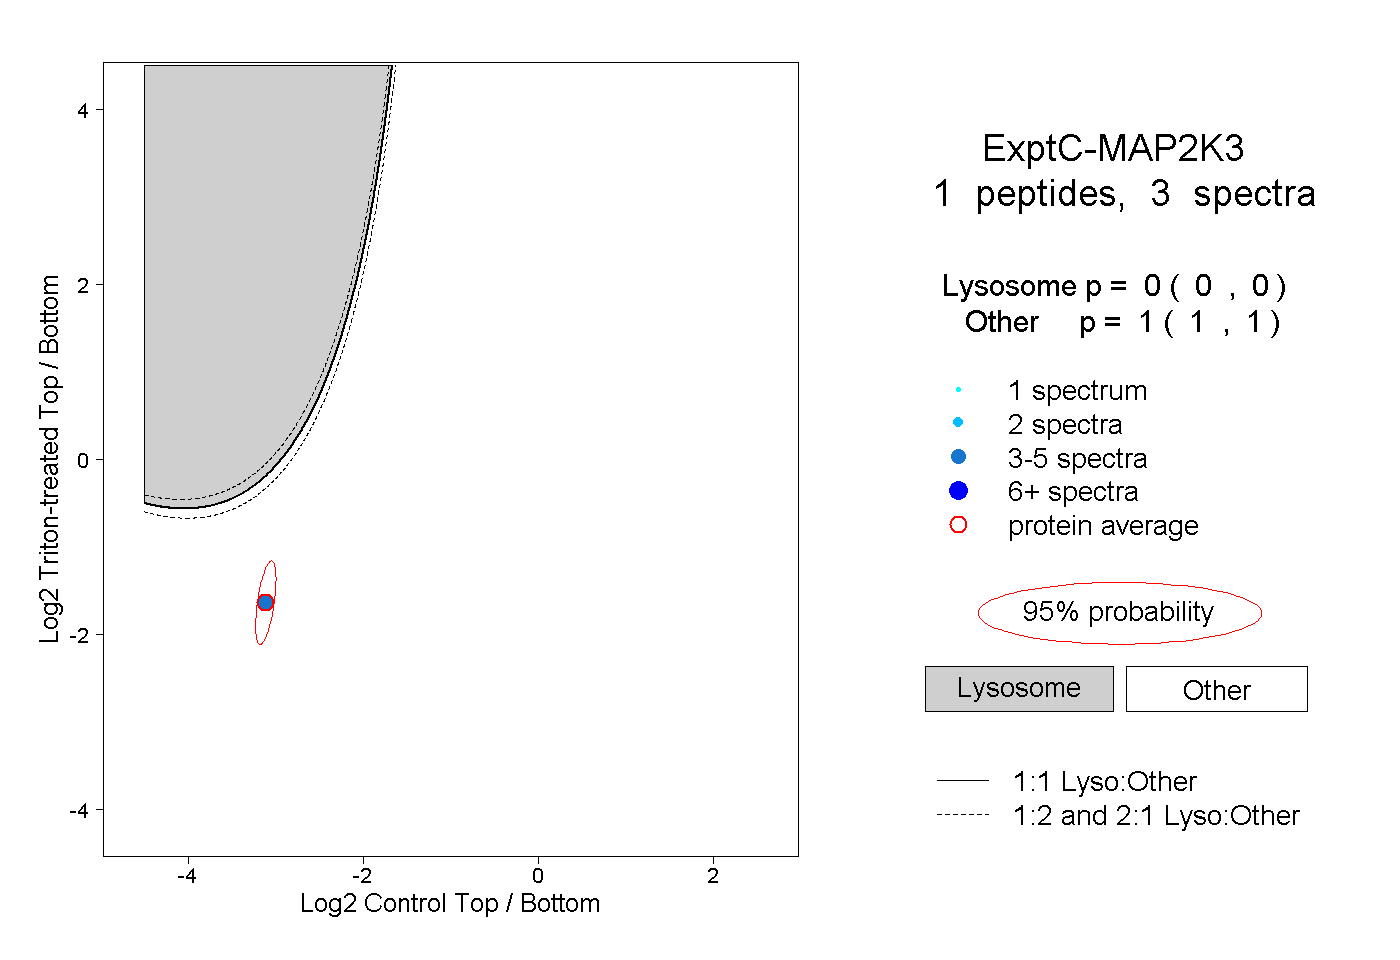
0.000 | 0.000
1.000 | 1.000