 7
7peptides
spectra
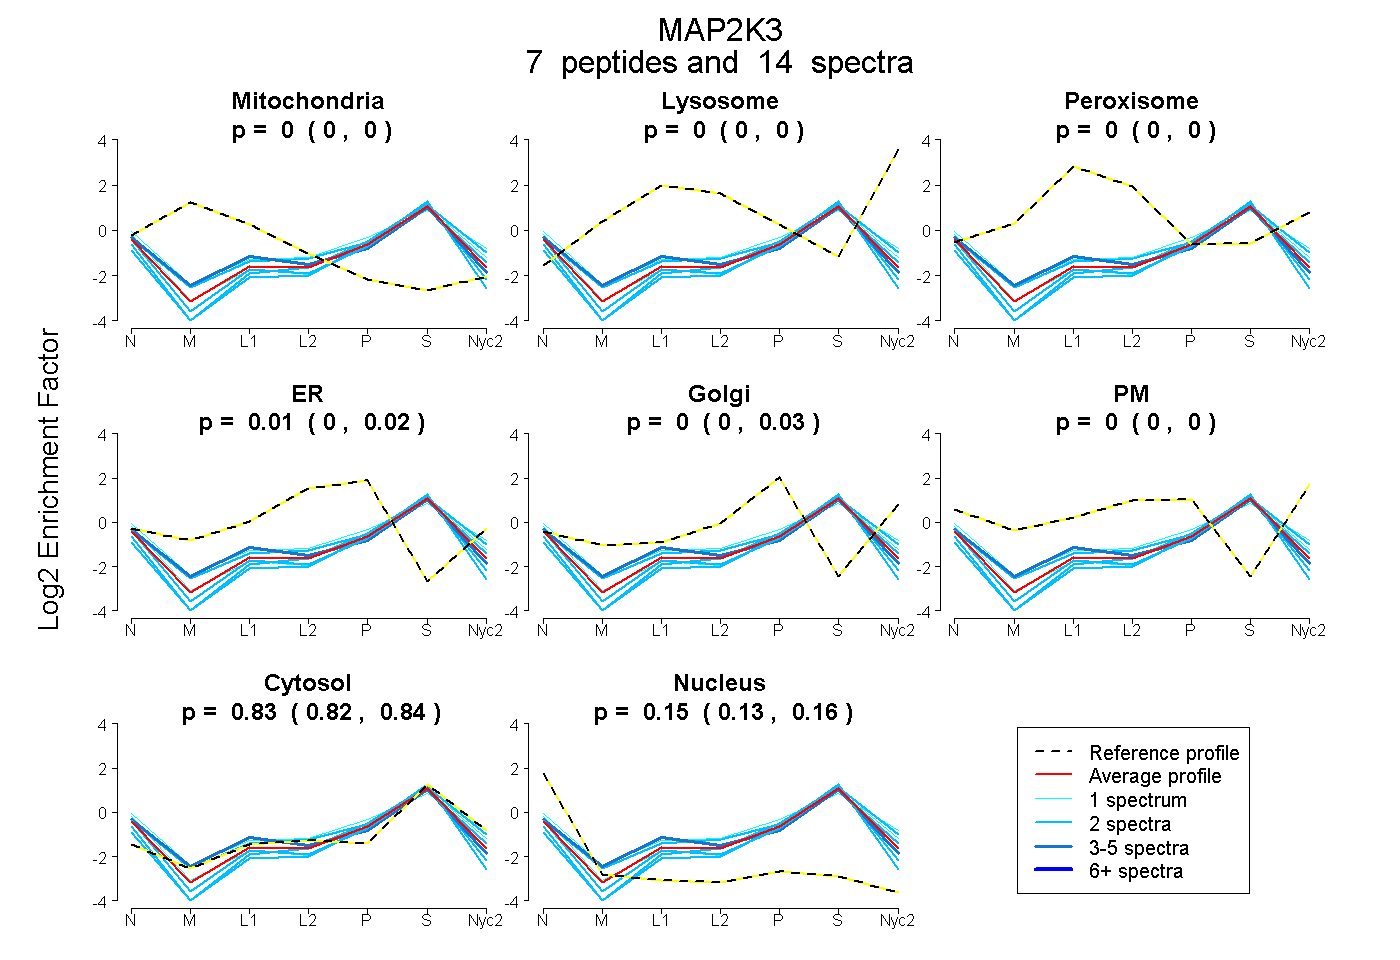
0.000 | 0.000
0.000 | 0.000
0.000 | 0.000
0.000 | 0.024
0.000 | 0.027
0.000 | 0.000
0.825 | 0.841
0.135 | 0.155
| Plot | Mito | Lyso | Perox | ER | Golgi | PM | Cytosol | Nucleus | |||||
| Expt A |
7 peptides |
14 spectra |
|
0.000 0.000 | 0.000 |
0.000 0.000 | 0.000 |
0.000 0.000 | 0.000 |
0.014 0.000 | 0.024 |
0.005 0.000 | 0.027 |
0.000 0.000 | 0.000 |
0.835 0.825 | 0.841 |
0.146 0.135 | 0.155 |
| 2 spectra, ISCVSKPPVSNPTPPR | 0.000 | 0.000 | 0.000 | 0.000 | 0.000 | 0.000 | 0.831 | 0.169 | ||
| 1 spectrum, DVKPSNVLINK | 0.000 | 0.000 | 0.000 | 0.000 | 0.111 | 0.080 | 0.735 | 0.074 | ||
| 4 spectra, LSVIHR | 0.000 | 0.000 | 0.016 | 0.051 | 0.000 | 0.000 | 0.783 | 0.150 | ||
| 1 spectrum, IPEDILGEIAVSIVR | 0.000 | 0.000 | 0.000 | 0.000 | 0.031 | 0.000 | 0.811 | 0.158 | ||
| 2 spectra, MSYLELMEHPFFTLHK | 0.000 | 0.000 | 0.000 | 0.000 | 0.000 | 0.000 | 0.806 | 0.194 | ||
| 2 spectra, ALEHLHSK | 0.000 | 0.000 | 0.000 | 0.106 | 0.000 | 0.000 | 0.795 | 0.099 | ||
| 2 spectra, TFITIGDR | 0.000 | 0.000 | 0.000 | 0.000 | 0.013 | 0.000 | 0.861 | 0.125 |
| Plot | Mito | Lyso or Perox | ER | Golgi | PM | Cytosol | Nucleus | ||||||
| Expt B |
1 peptide |
2 spectra |
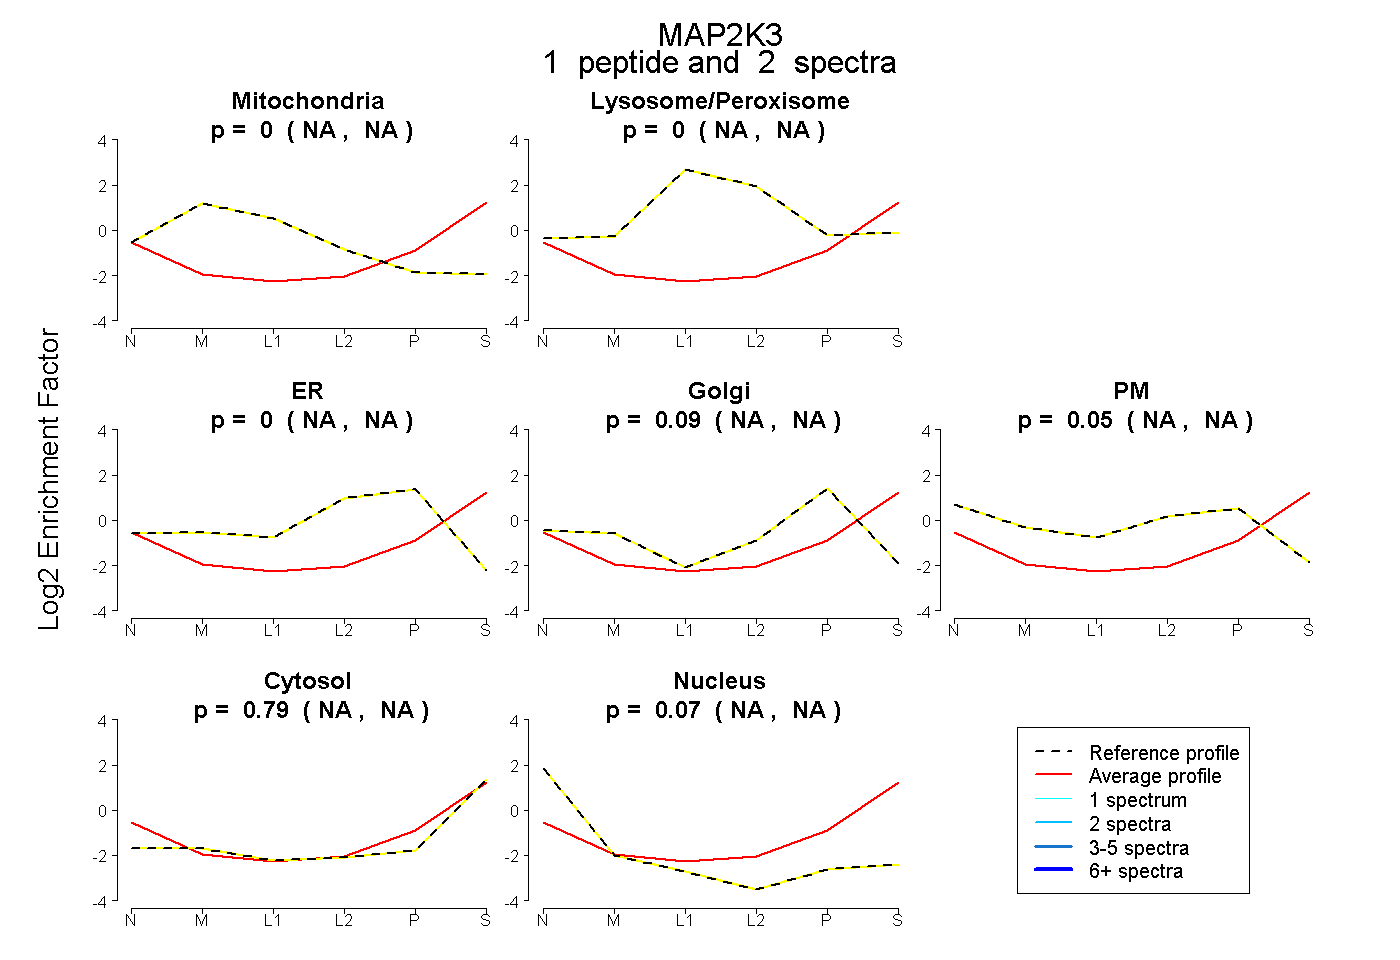 |
0.000 NA | NA |
0.000 NA | NA |
0.000 NA | NA |
0.091 NA | NA |
0.049 NA | NA |
0.788 NA | NA |
0.072 NA | NA |
|||
| Plot | Lyso | Other | |||||||||||
| Expt C |
1 peptide |
3 spectra |
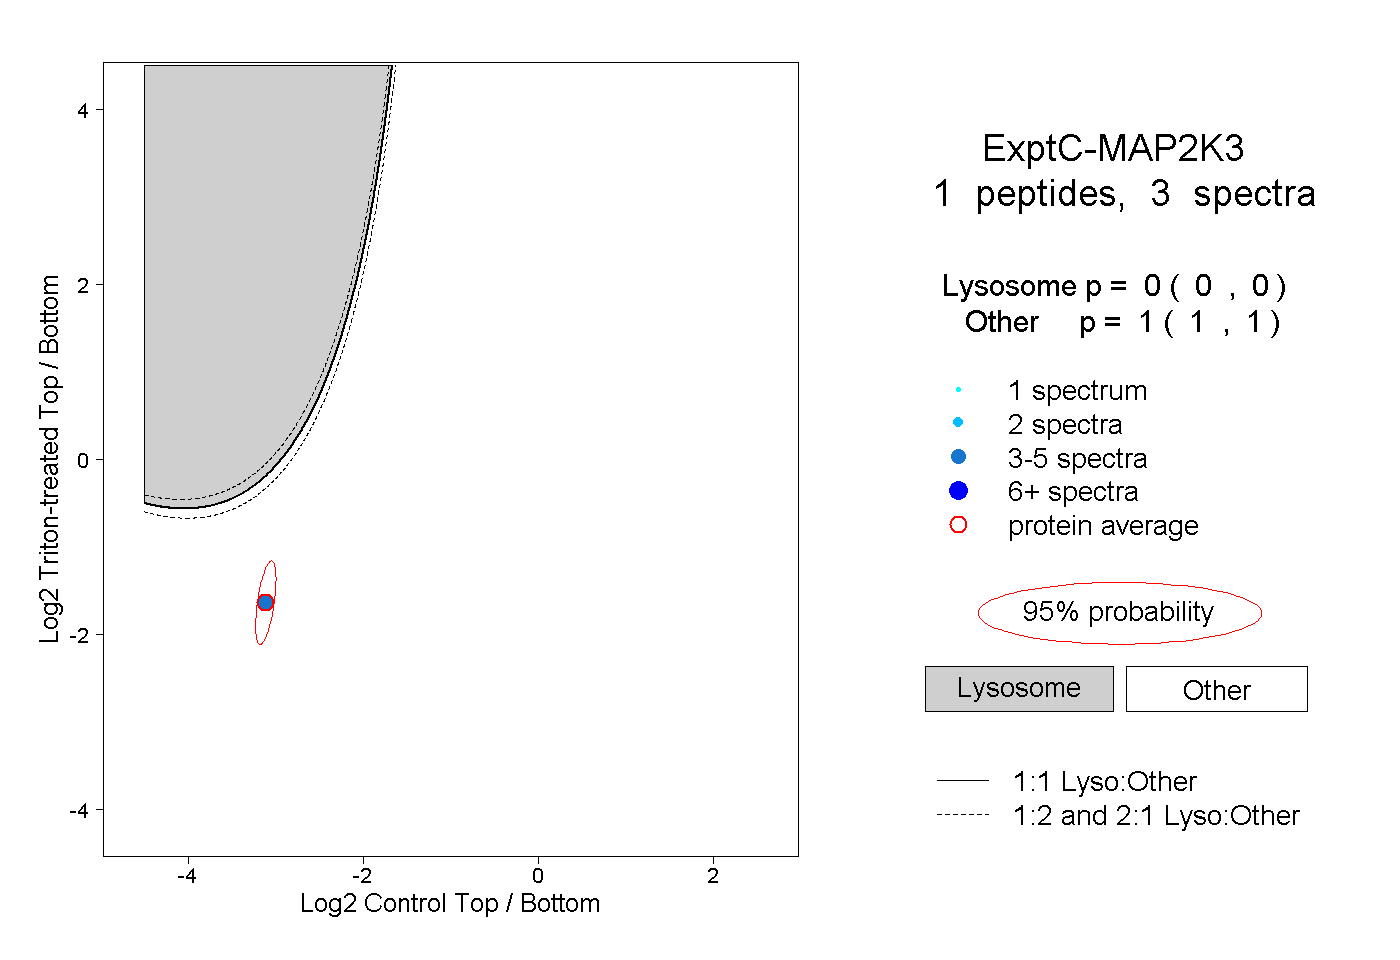 |
0.000 0.000 | 0.000 |
1.000 1.000 | 1.000 |