 8
8peptides
spectra
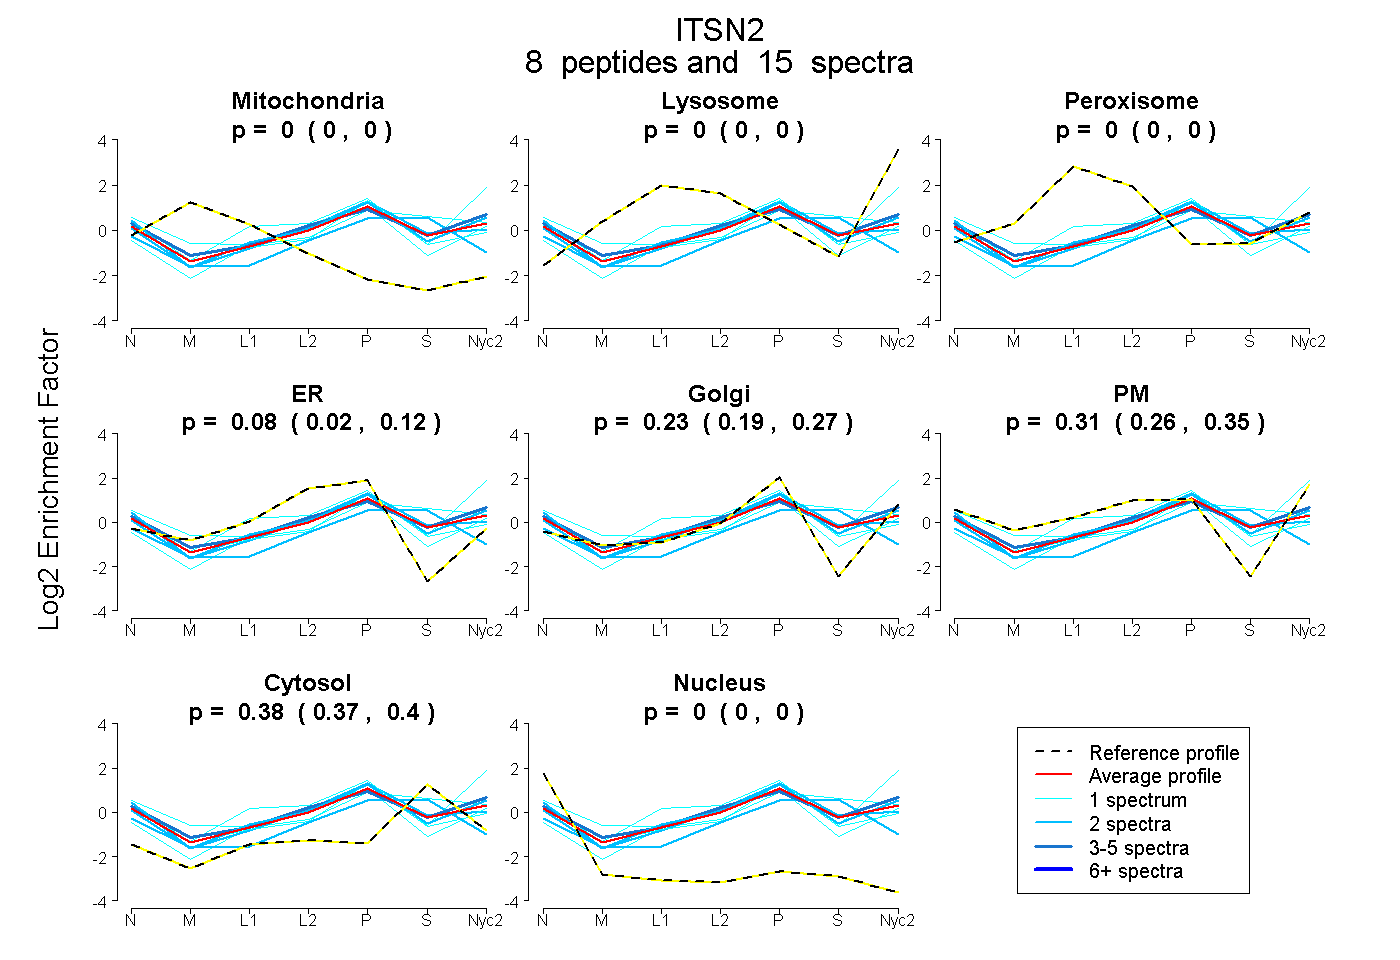
0.000 | 0.000
0.000 | 0.000
0.000 | 0.000
0.021 | 0.123
0.191 | 0.267
0.259 | 0.346
0.367 | 0.397
0.000 | 0.000
3peptides
spectra
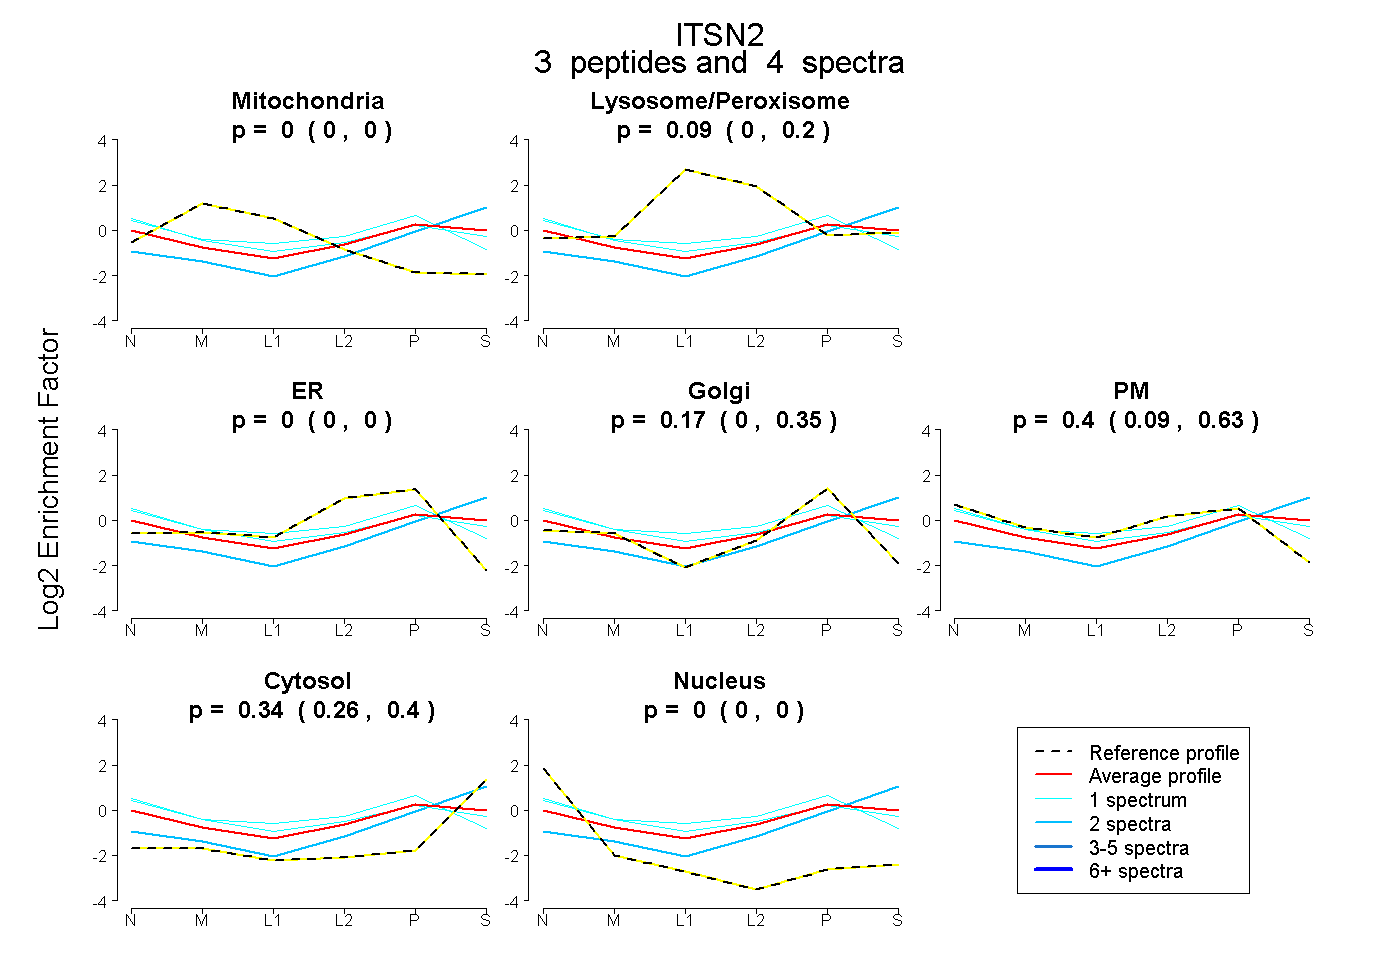
0.000 | 0.000
0.000 | 0.195
0.000 | 0.000
0.000 | 0.354
0.091 | 0.628
0.261 | 0.401
0.000 | 0.000
9peptides
spectra
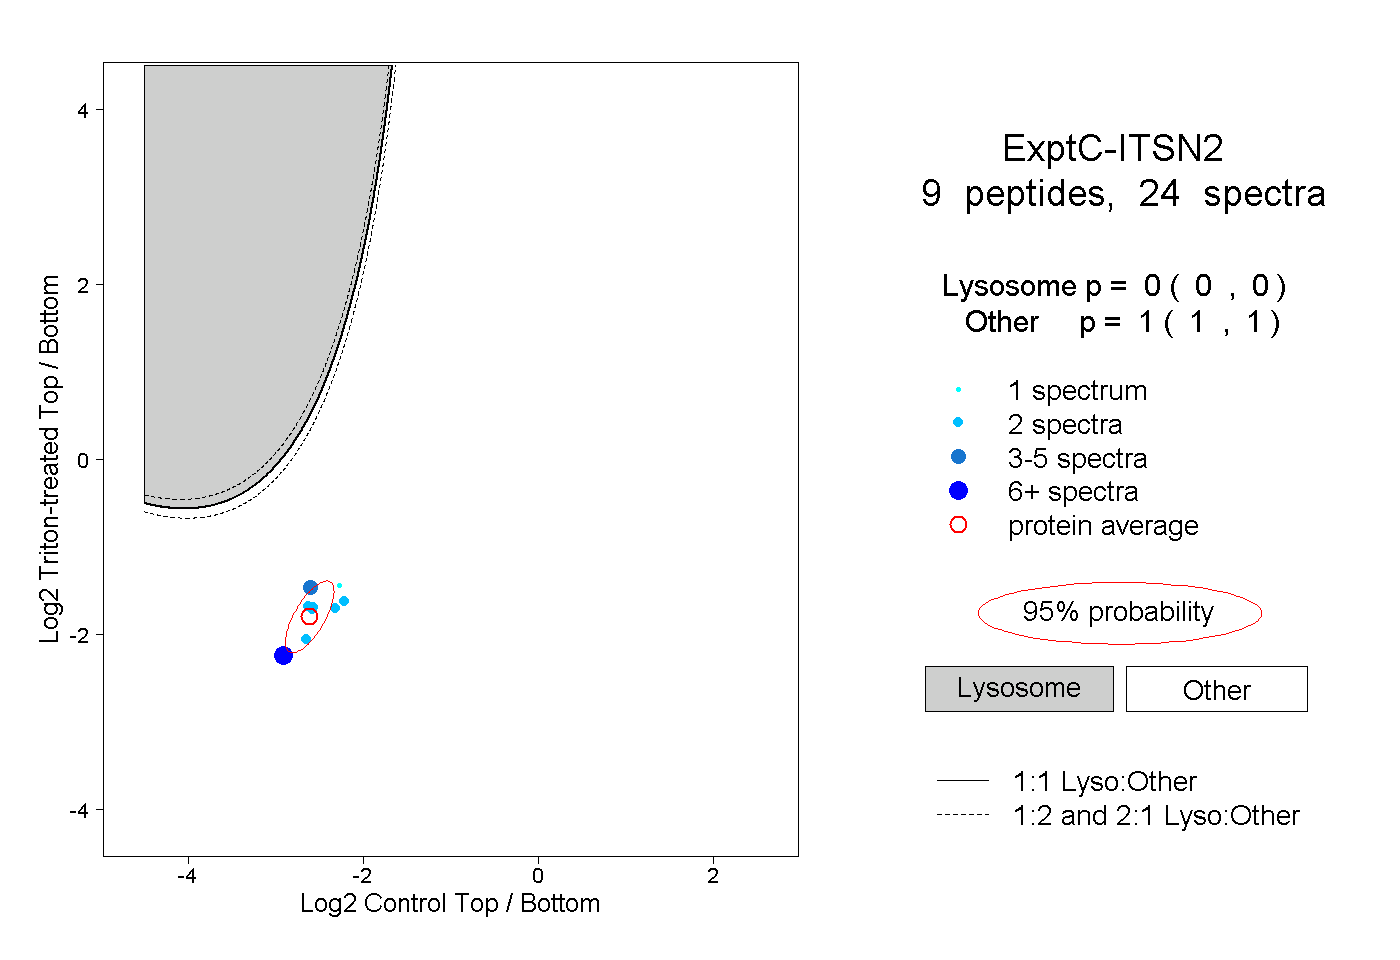
0.000 | 0.000
1.000 | 1.000
2peptides
spectra
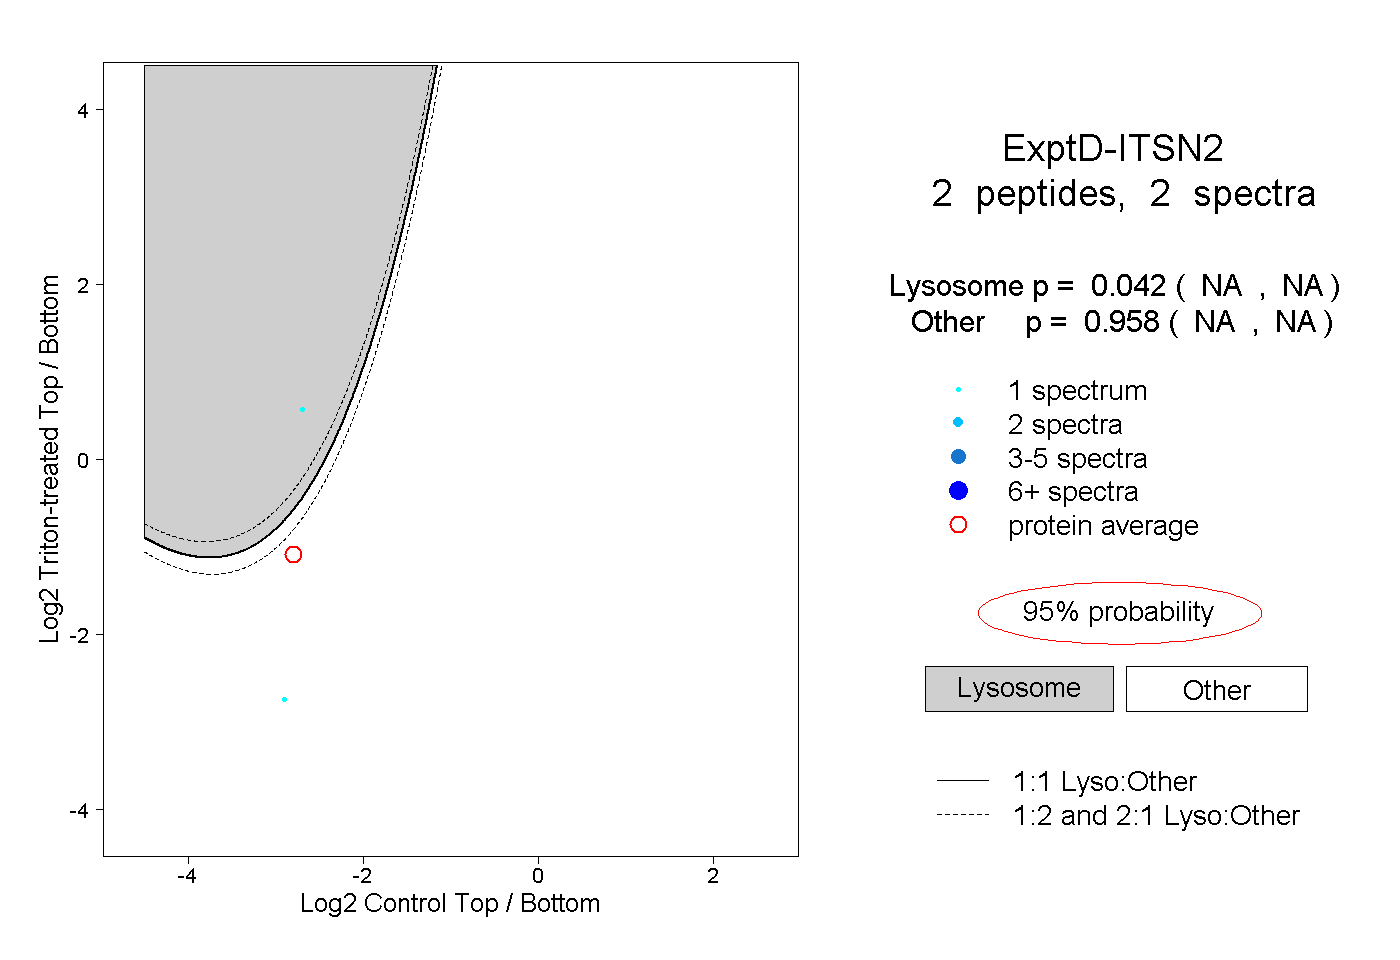
NA | NA
NA | NA