 8
8peptides
spectra
0.000 | 0.000
0.000 | 0.000
0.000 | 0.000
0.021 | 0.123
0.191 | 0.267
0.259 | 0.346
0.367 | 0.397
0.000 | 0.000
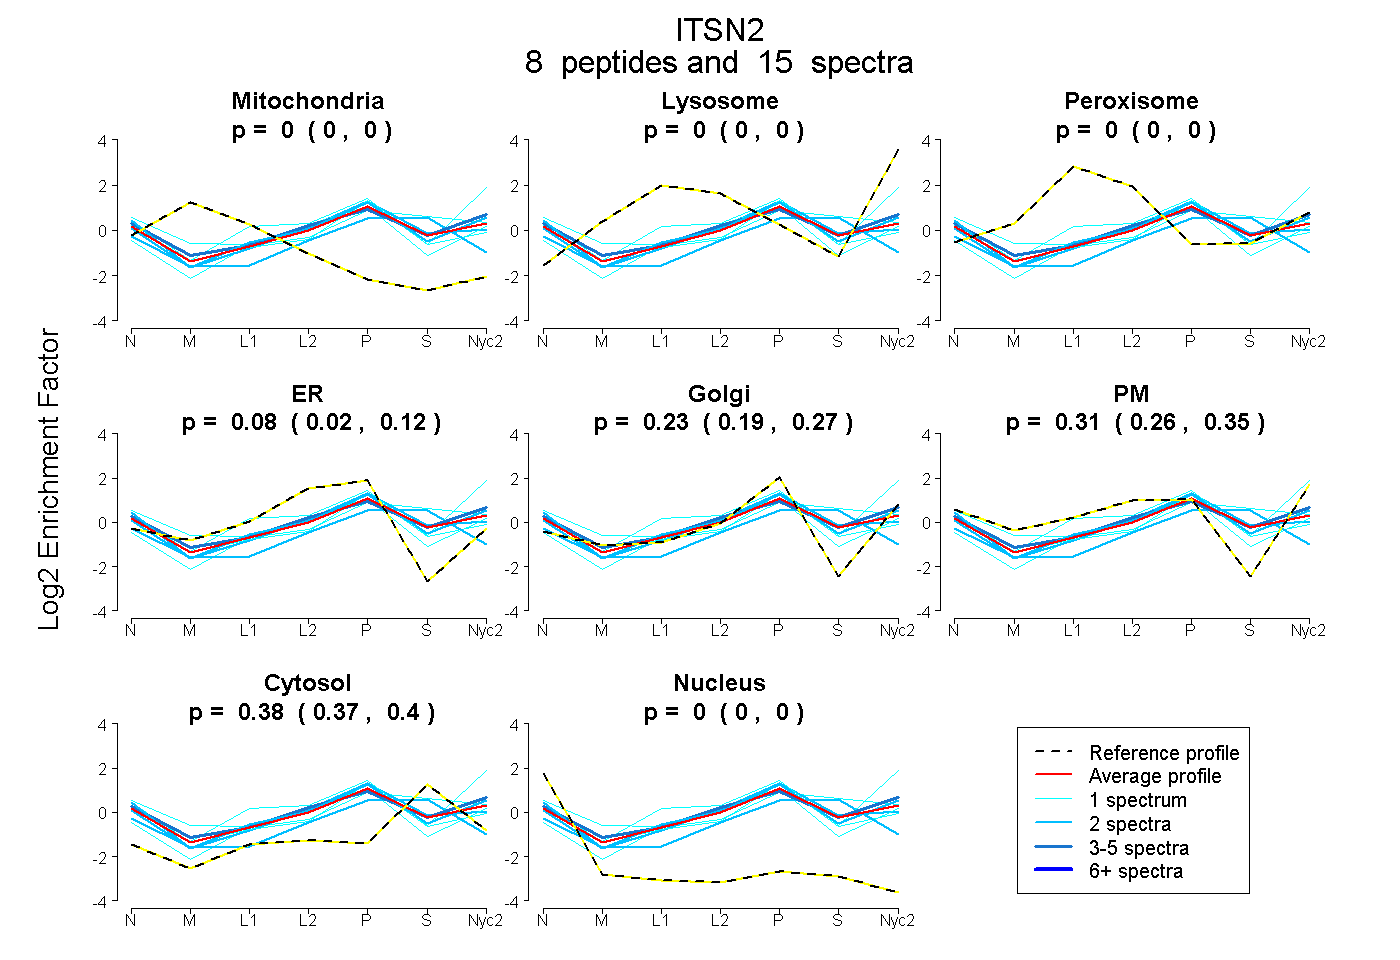
| Plot | Mito | Lyso | Perox | ER | Golgi | PM | Cytosol | Nucleus | |||||
| Expt A |
8 peptides |
15 spectra |
|
0.000 0.000 | 0.000 |
0.000 0.000 | 0.000 |
0.000 0.000 | 0.000 |
0.076 0.021 | 0.123 |
0.233 0.191 | 0.267 |
0.308 0.259 | 0.346 |
0.382 0.367 | 0.397 |
0.000 0.000 | 0.000 |
| 1 spectrum, DGEWWTGSIGER | 0.000 | 0.064 | 0.027 | 0.000 | 0.357 | 0.027 | 0.526 | 0.000 | ||
| 2 spectra, QCDLEIMEIK | 0.000 | 0.000 | 0.000 | 0.230 | 0.134 | 0.000 | 0.618 | 0.018 | ||
| 1 spectrum, LLGPSAER | 0.000 | 0.000 | 0.000 | 0.198 | 0.103 | 0.439 | 0.216 | 0.045 | ||
| 1 spectrum, SMSGYLSGFQAR | 0.000 | 0.183 | 0.000 | 0.000 | 0.213 | 0.412 | 0.192 | 0.000 | ||
| 2 spectra, TGIFPSNYVRPK | 0.000 | 0.000 | 0.000 | 0.021 | 0.284 | 0.370 | 0.325 | 0.000 | ||
| 2 spectra, ELQEQEWK | 0.000 | 0.000 | 0.000 | 0.220 | 0.254 | 0.132 | 0.394 | 0.000 | ||
| 5 spectra, TELEVLDK | 0.000 | 0.000 | 0.000 | 0.000 | 0.113 | 0.520 | 0.367 | 0.000 | ||
| 1 spectrum, ESYNTQQLALEQLHK | 0.000 | 0.000 | 0.000 | 0.082 | 0.419 | 0.158 | 0.306 | 0.035 |
| Plot | Mito | Lyso or Perox | ER | Golgi | PM | Cytosol | Nucleus | ||||||
| Expt B |
3 peptides |
4 spectra |
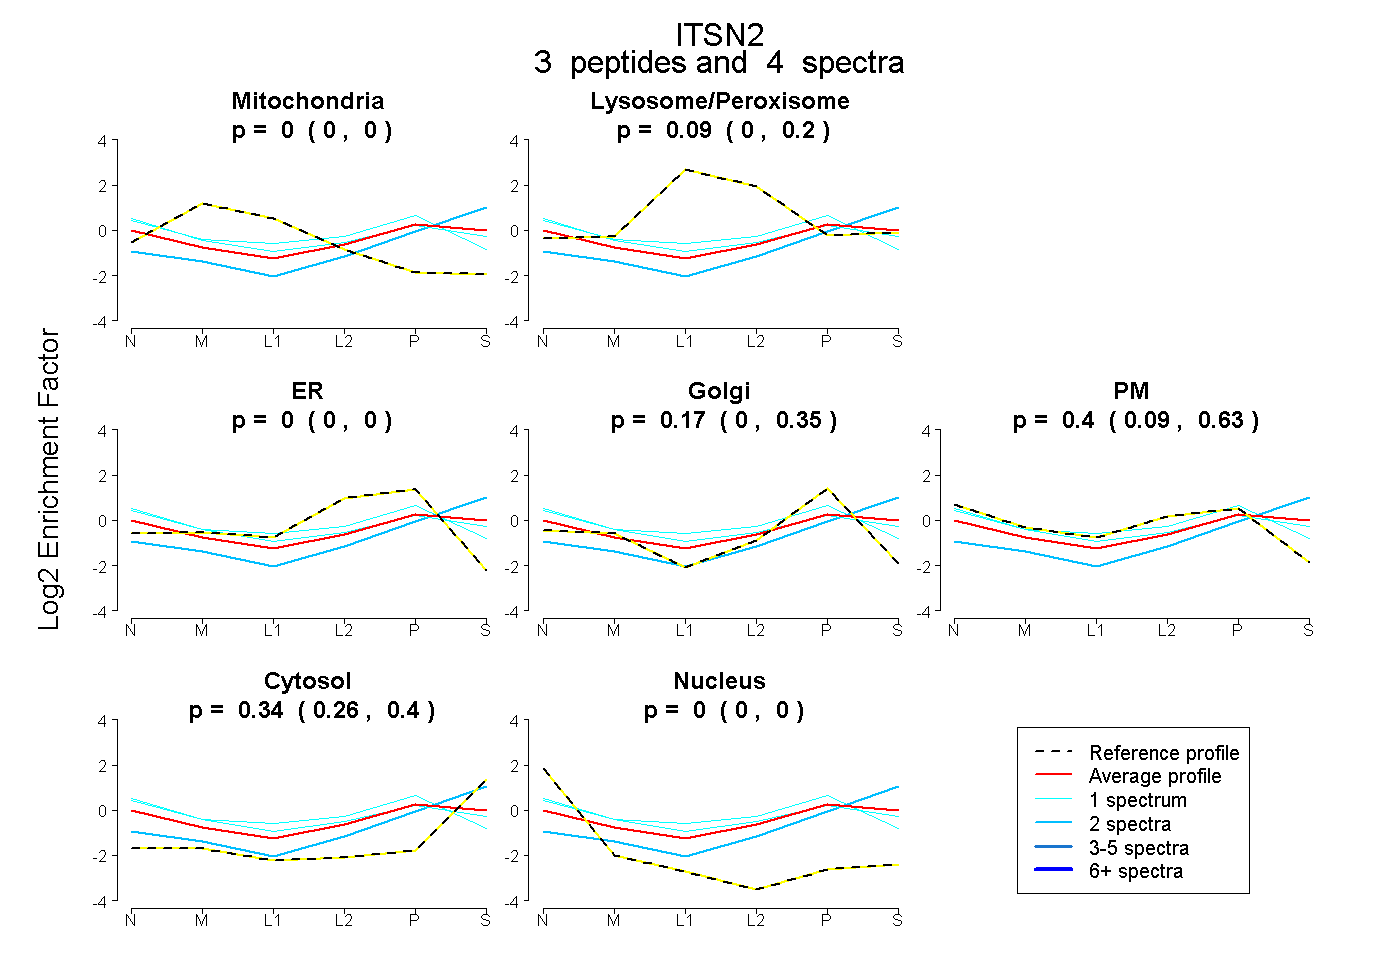 |
0.000 0.000 | 0.000 |
0.094 0.000 | 0.195 |
0.000 0.000 | 0.000 |
0.168 0.000 | 0.354 |
0.398 0.091 | 0.628 |
0.340 0.261 | 0.401 |
0.000 0.000 | 0.000 |
|||
| Plot | Lyso | Other | |||||||||||
| Expt C |
9 peptides |
24 spectra |
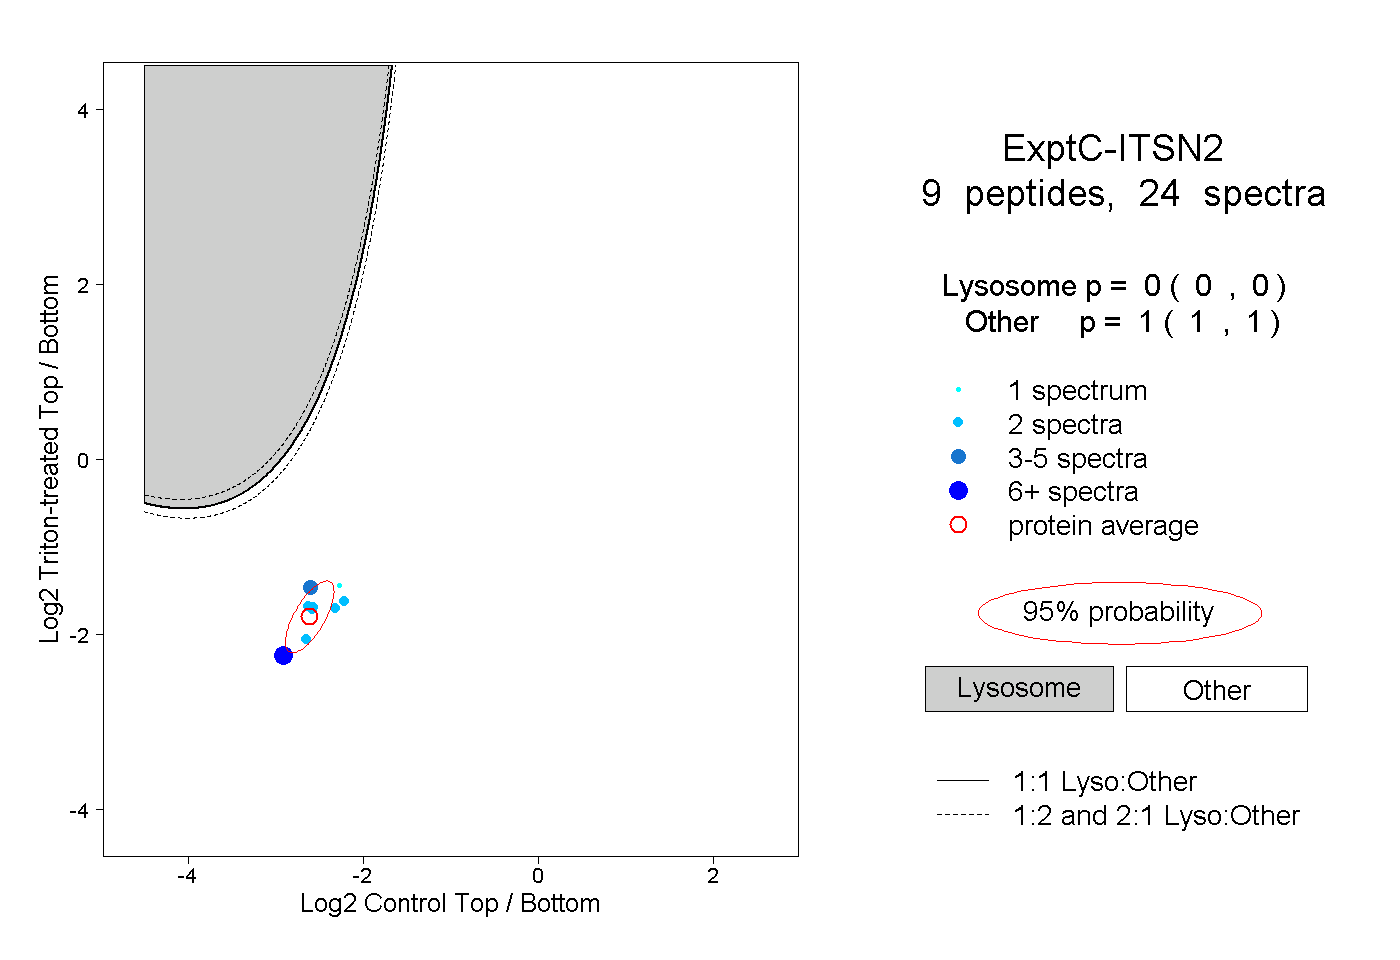 |
0.000 0.000 | 0.000 |
1.000 1.000 | 1.000 |
||||||||
| Plot | Lyso | Other | |||||||||||
| Expt D |
2 peptides |
2 spectra |
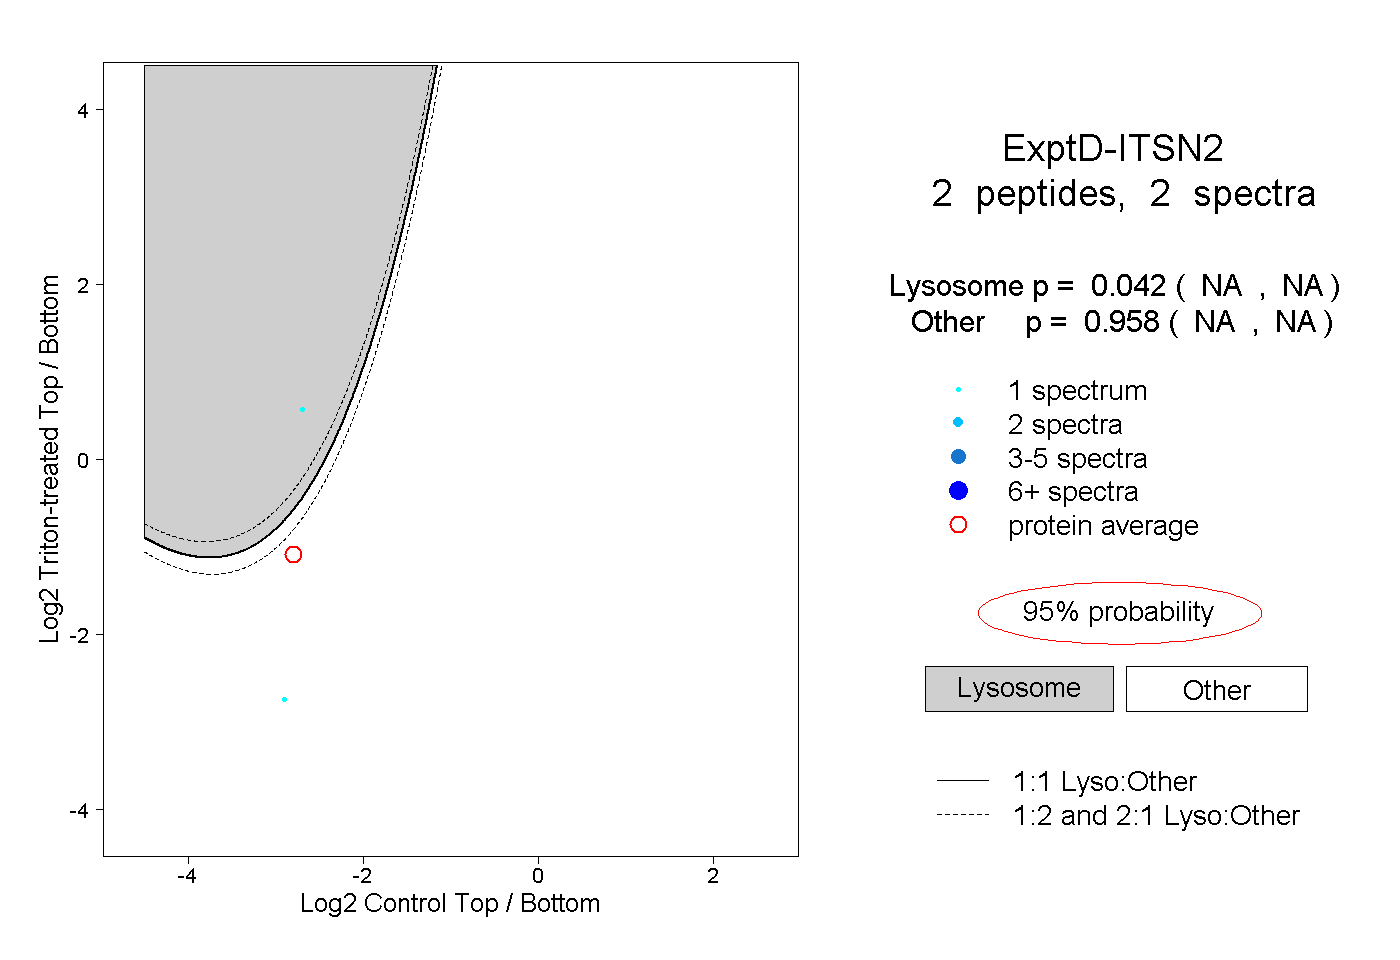 |
0.042 NA | NA |
0.958 NA | NA |