 20
20peptides
spectra
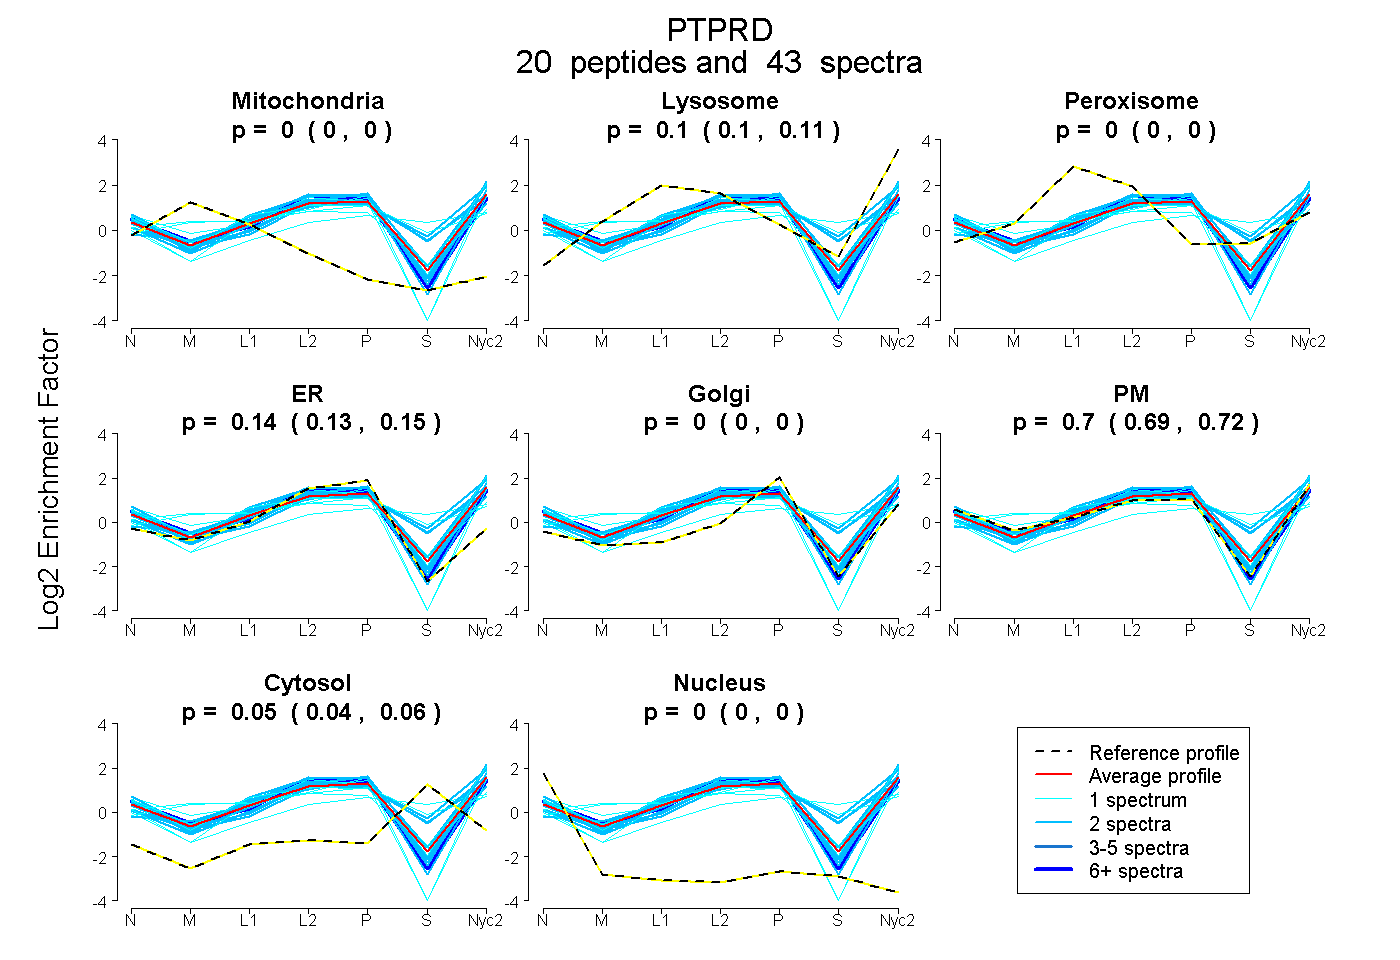
0.000 | 0.000
0.095 | 0.109
0.000 | 0.005
0.131 | 0.150
0.000 | 0.000
0.691 | 0.717
0.043 | 0.056
0.000 | 0.000
9peptides
spectra
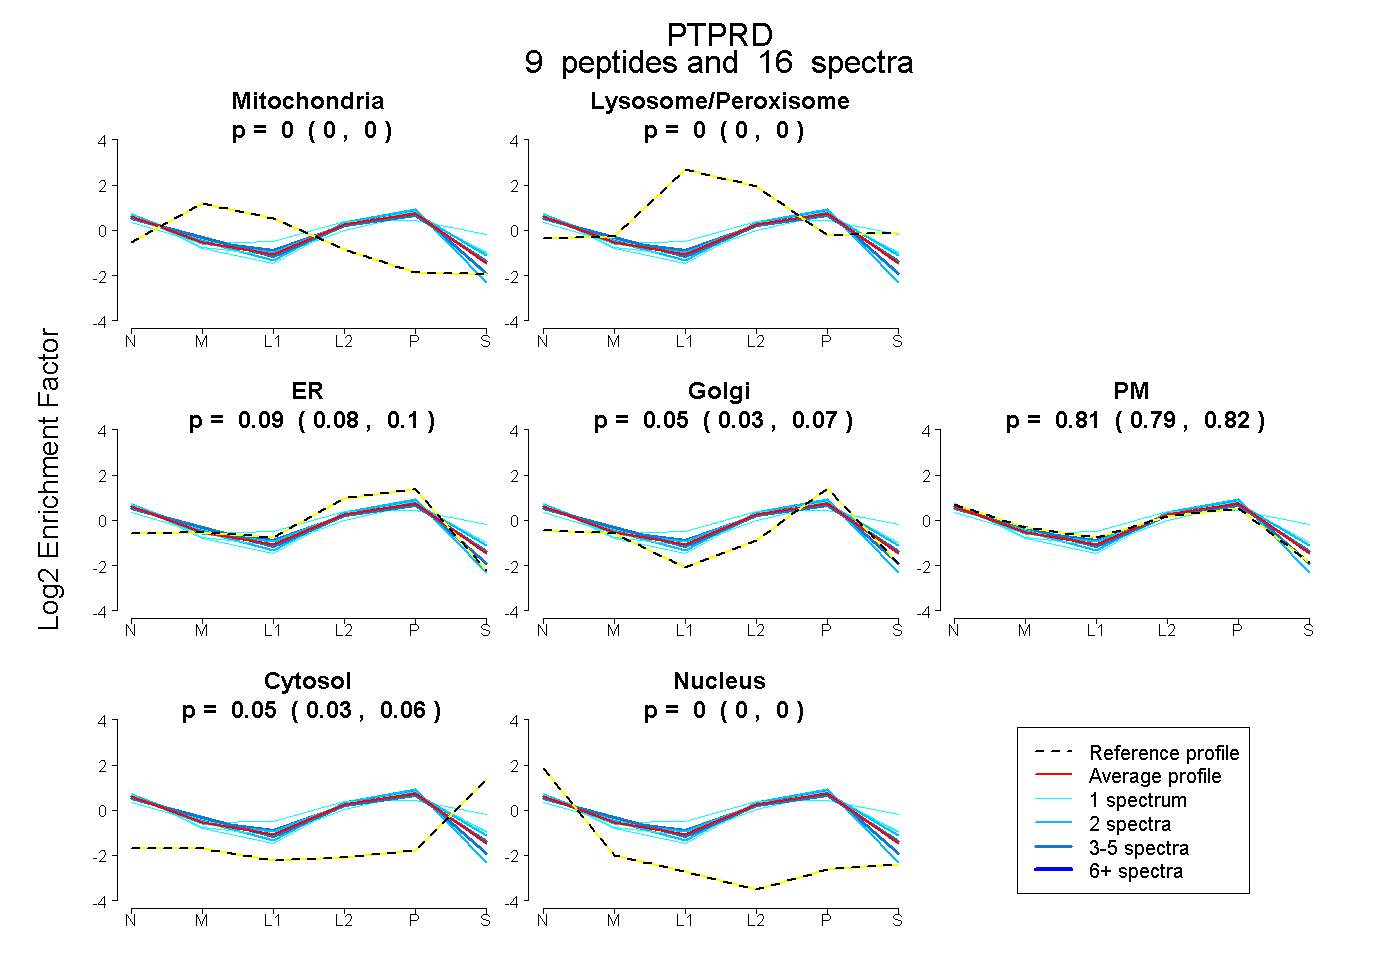
0.000 | 0.000
0.000 | 0.000
0.079 | 0.102
0.033 | 0.070
0.794 | 0.819
0.033 | 0.057
0.000 | 0.000
29peptides
spectra
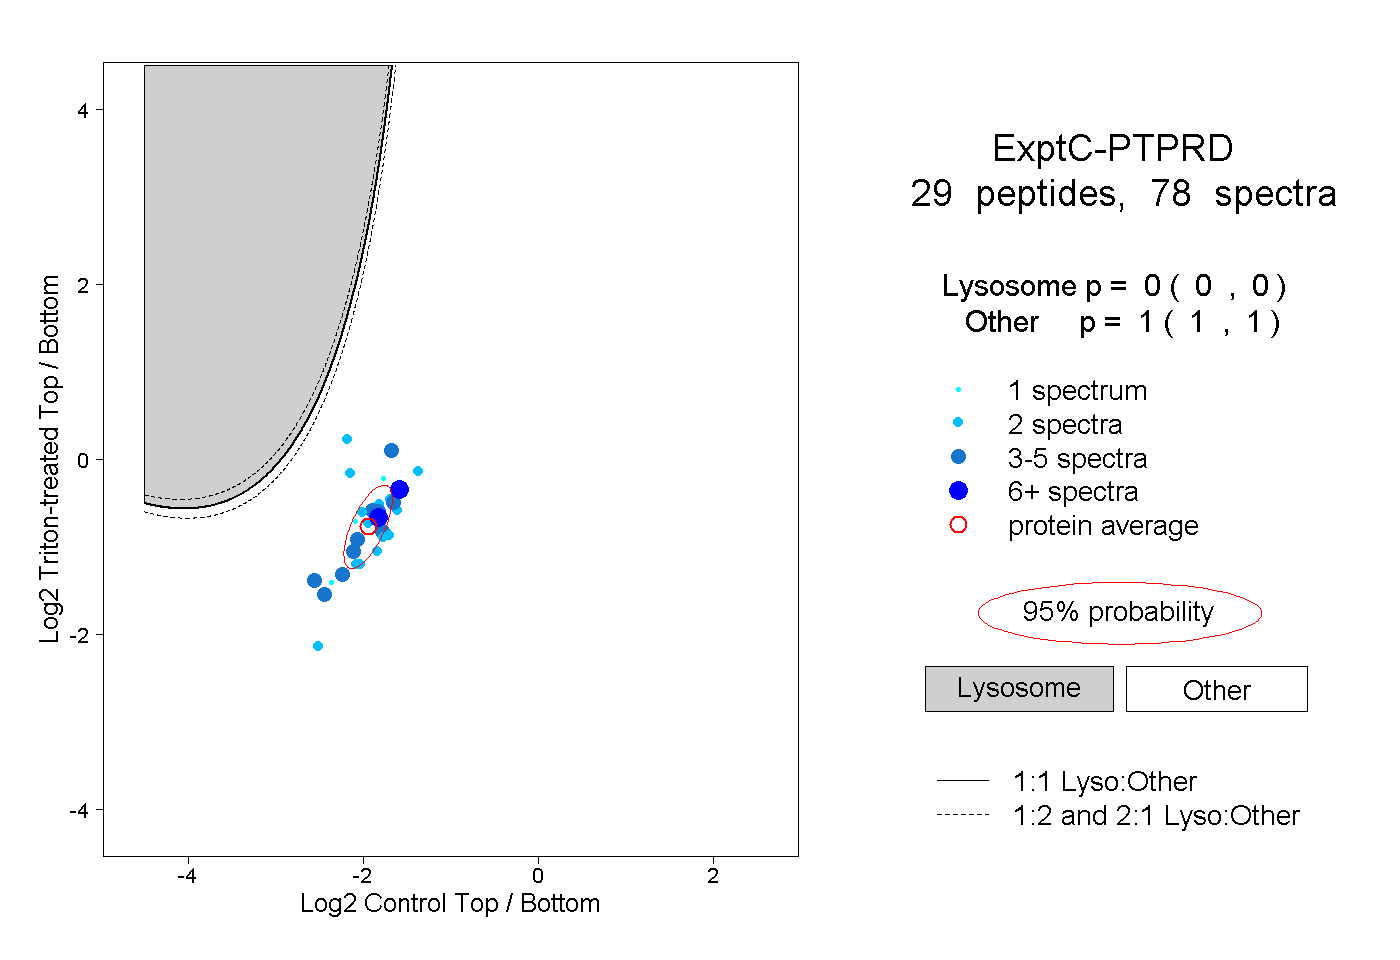
0.000 | 0.000
1.000 | 1.000
10peptides
spectra
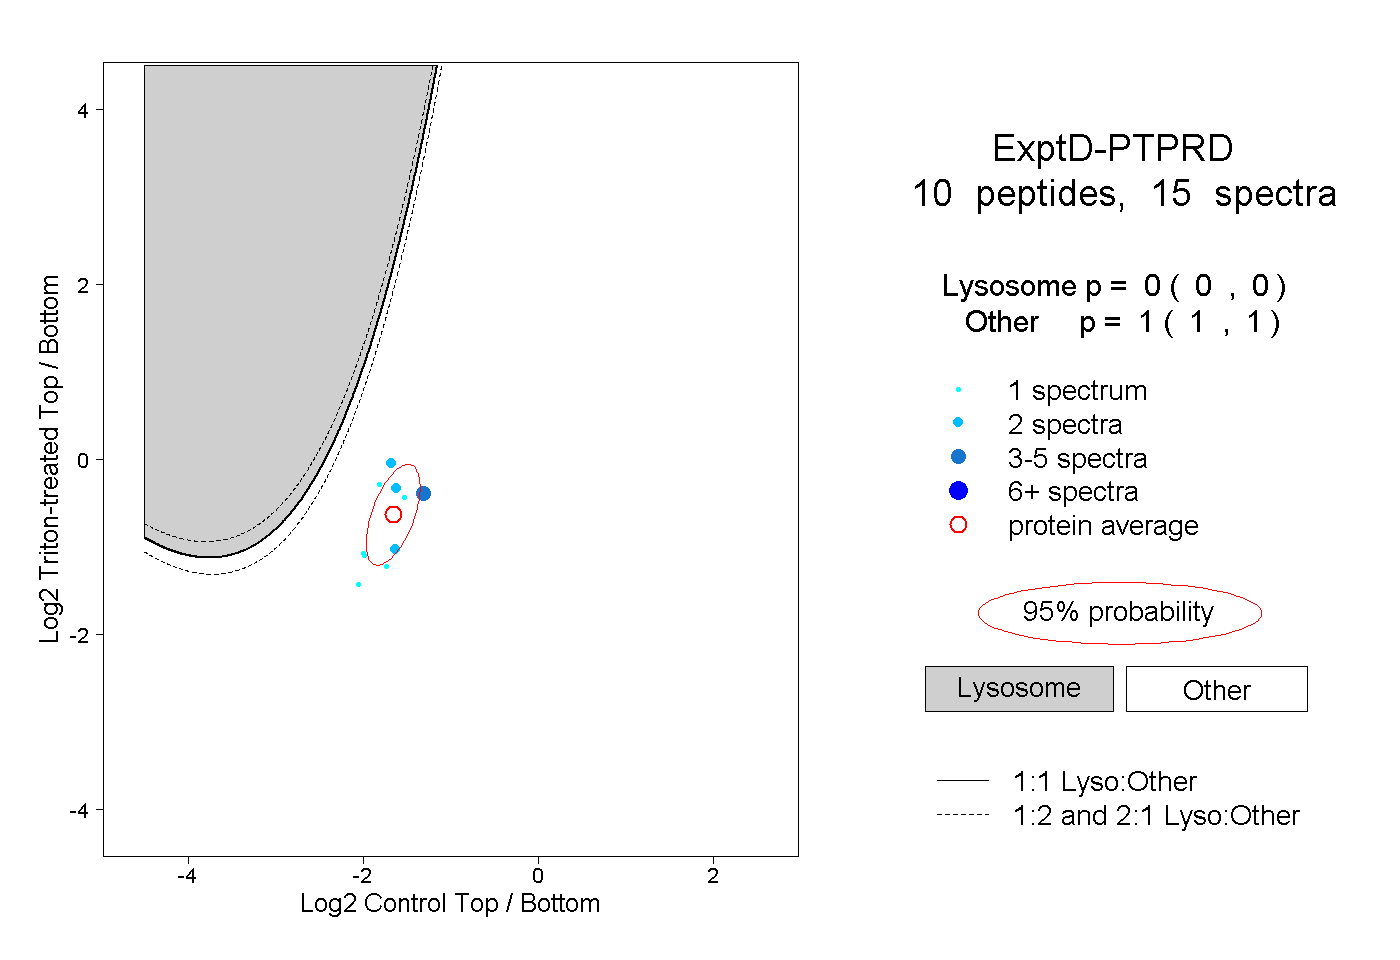
0.000 | 0.000
1.000 | 1.000