 20
20peptides
spectra
0.000 | 0.000
0.095 | 0.109
0.000 | 0.005
0.131 | 0.150
0.000 | 0.000
0.691 | 0.717
0.043 | 0.056
0.000 | 0.000
| Plot | Mito | Lyso | Perox | ER | Golgi | PM | Cytosol | Nucleus | |||||
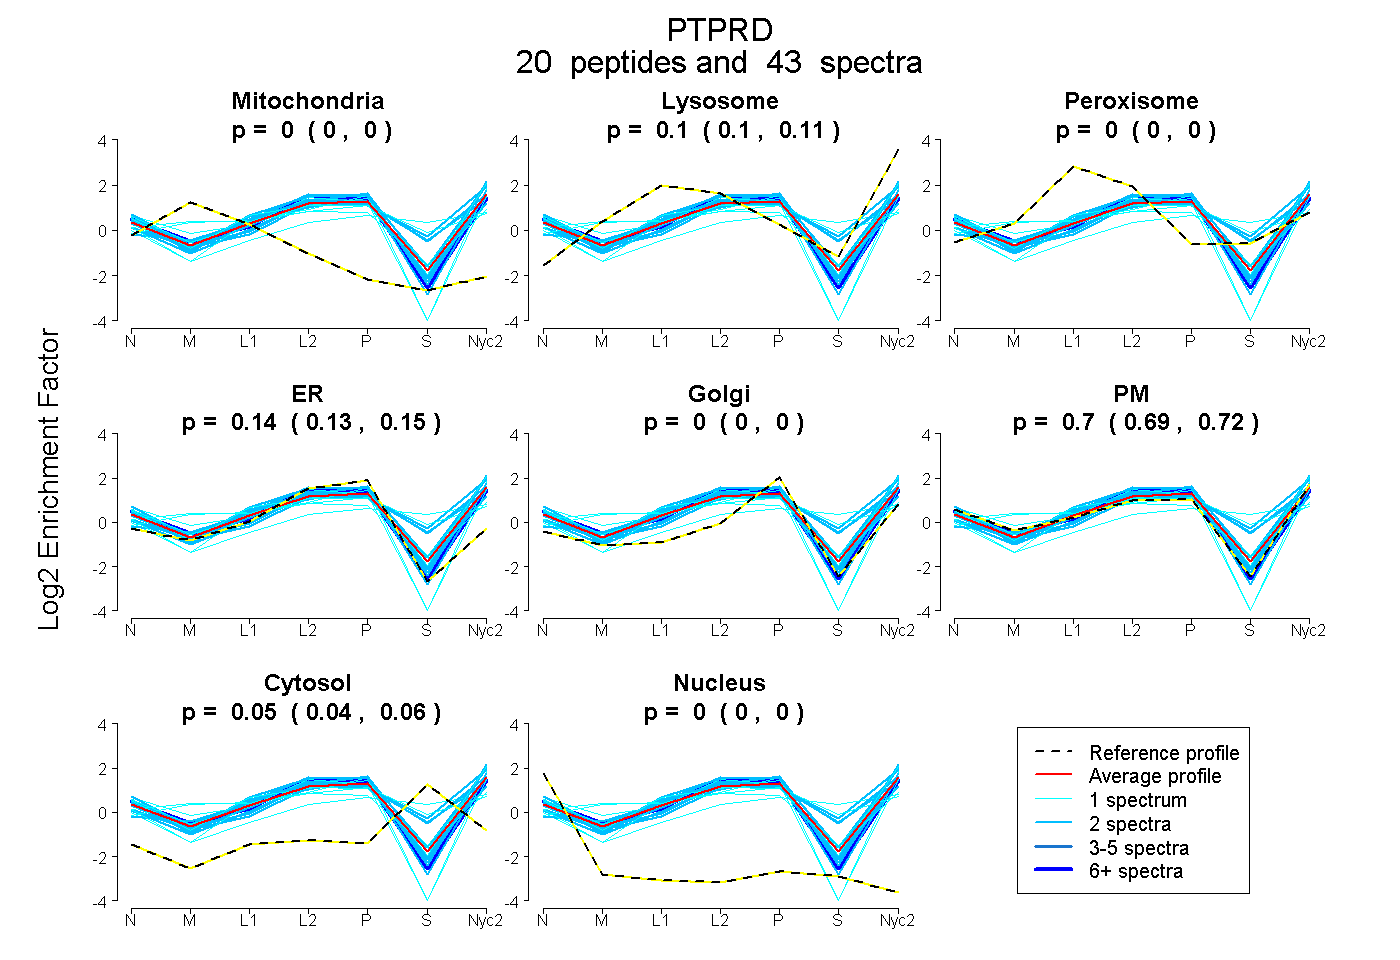
| Expt A |
20 peptides |
43 spectra |
|
0.000 0.000 | 0.000 |
0.104 0.095 | 0.109 |
0.000 0.000 | 0.005 |
0.141 0.131 | 0.150 |
0.000 0.000 | 0.000 |
0.705 0.691 | 0.717 |
0.050 0.043 | 0.056 |
0.000 0.000 | 0.000 |
| 2 spectra, MIWEQR | 0.000 | 0.316 | 0.039 | 0.194 | 0.000 | 0.302 | 0.149 | 0.000 | ||
| 1 spectrum, YSAPANLYVR | 0.000 | 0.012 | 0.080 | 0.000 | 0.000 | 0.833 | 0.075 | 0.000 | ||
| 2 spectra, GPGPYSPSVQFR | 0.000 | 0.024 | 0.034 | 0.160 | 0.058 | 0.724 | 0.000 | 0.000 | ||
| 1 spectrum, NVLELNDVR | 0.000 | 0.000 | 0.000 | 0.044 | 0.000 | 0.956 | 0.000 | 0.000 | ||
| 2 spectra, ITIEPGTSYR | 0.000 | 0.149 | 0.000 | 0.000 | 0.133 | 0.686 | 0.032 | 0.000 | ||
| 2 spectra, SGEGFIDFIGQVHK | 0.000 | 0.044 | 0.000 | 0.161 | 0.000 | 0.795 | 0.000 | 0.000 | ||
| 2 spectra, MVEEVDGR | 0.000 | 0.063 | 0.000 | 0.318 | 0.028 | 0.545 | 0.046 | 0.000 | ||
| 2 spectra, VVAVNNIGR | 0.000 | 0.116 | 0.000 | 0.075 | 0.000 | 0.809 | 0.000 | 0.000 | ||
| 2 spectra, EDQIPR | 0.000 | 0.251 | 0.000 | 0.000 | 0.000 | 0.530 | 0.219 | 0.000 | ||
| 2 spectra, SDTIASYELVYR | 0.000 | 0.151 | 0.000 | 0.000 | 0.000 | 0.843 | 0.006 | 0.000 | ||
| 2 spectra, TDEDVPSGPPR | 0.000 | 0.000 | 0.000 | 0.071 | 0.000 | 0.883 | 0.045 | 0.000 | ||
| 1 spectrum, TLPVDQVFAK | 0.022 | 0.029 | 0.000 | 0.232 | 0.000 | 0.718 | 0.000 | 0.000 | ||
| 1 spectrum, YSVAGLSPYSDYEFR | 0.000 | 0.125 | 0.000 | 0.000 | 0.039 | 0.836 | 0.000 | 0.000 | ||
| 2 spectra, GVEGSDYINASFIDGYR | 0.000 | 0.027 | 0.005 | 0.162 | 0.000 | 0.806 | 0.000 | 0.000 | ||
| 1 spectrum, YLLEQLEK | 0.100 | 0.020 | 0.242 | 0.000 | 0.211 | 0.427 | 0.000 | 0.000 | ||
| 2 spectra, EPEEPNGQIQGYR | 0.000 | 0.160 | 0.000 | 0.095 | 0.000 | 0.521 | 0.225 | 0.000 | ||
| 1 spectrum, GASYIFR | 0.000 | 0.064 | 0.017 | 0.000 | 0.000 | 0.465 | 0.454 | 0.000 | ||
| 12 spectra, LVSTTGAVPGRPR | 0.000 | 0.010 | 0.000 | 0.229 | 0.000 | 0.761 | 0.000 | 0.000 | ||
| 2 spectra, FEVIEFDDGSGSVLR | 0.000 | 0.123 | 0.000 | 0.075 | 0.000 | 0.801 | 0.000 | 0.000 | ||
| 1 spectrum, VCLQPIR | 0.000 | 0.000 | 0.240 | 0.108 | 0.121 | 0.273 | 0.258 | 0.000 |
| Plot | Mito | Lyso or Perox | ER | Golgi | PM | Cytosol | Nucleus | ||||||
| Expt B |
9 peptides |
16 spectra |
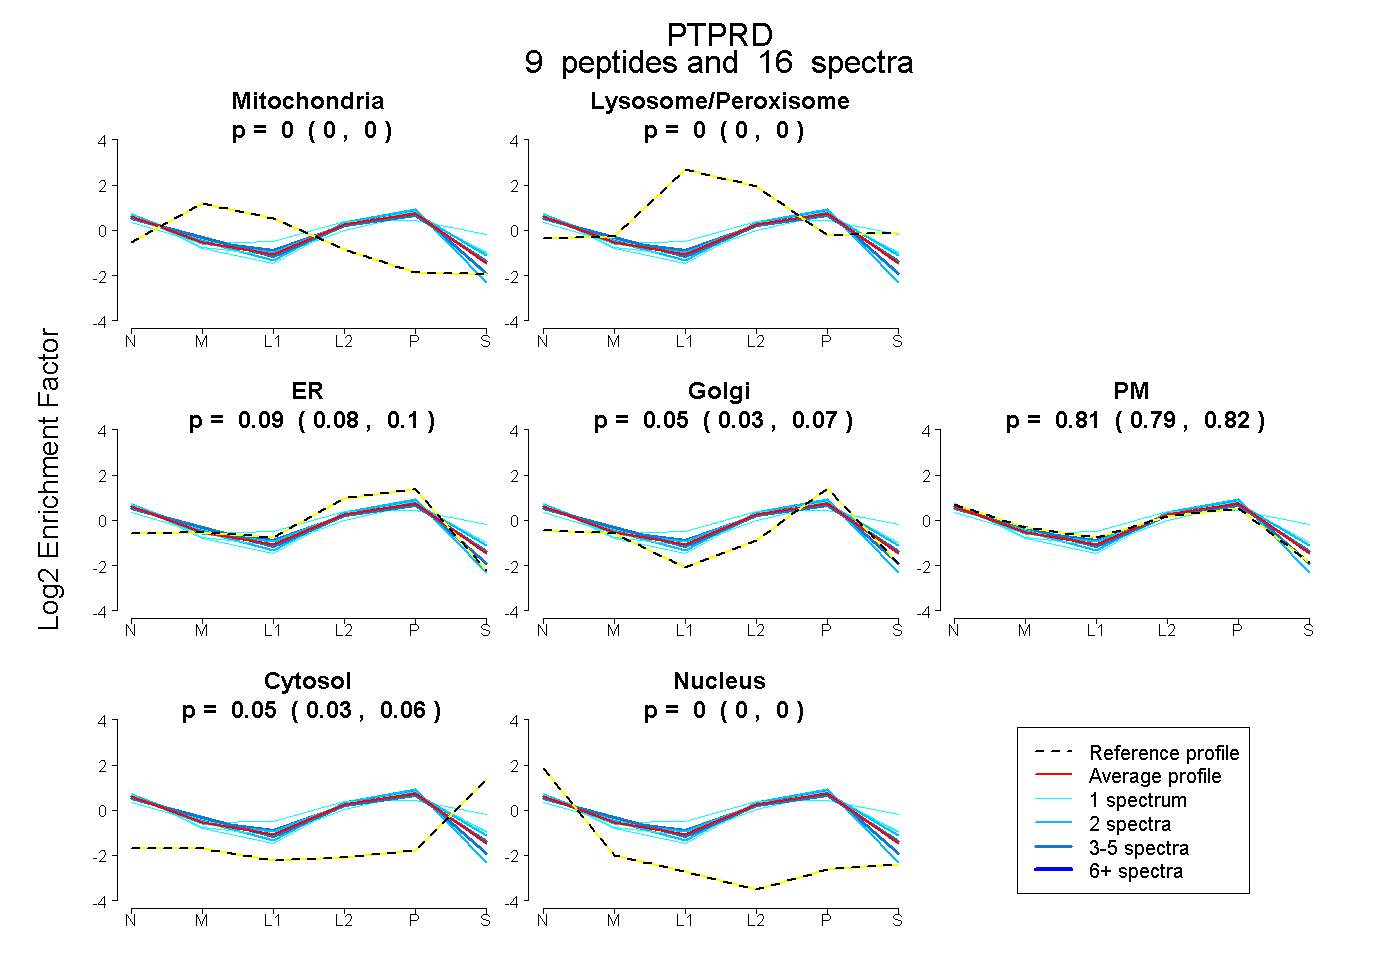 |
0.000 0.000 | 0.000 |
0.000 0.000 | 0.000 |
0.092 0.079 | 0.102 |
0.053 0.033 | 0.070 |
0.809 0.794 | 0.819 |
0.046 0.033 | 0.057 |
0.000 0.000 | 0.000 |
|||
| Plot | Lyso | Other | |||||||||||
| Expt C |
29 peptides |
78 spectra |
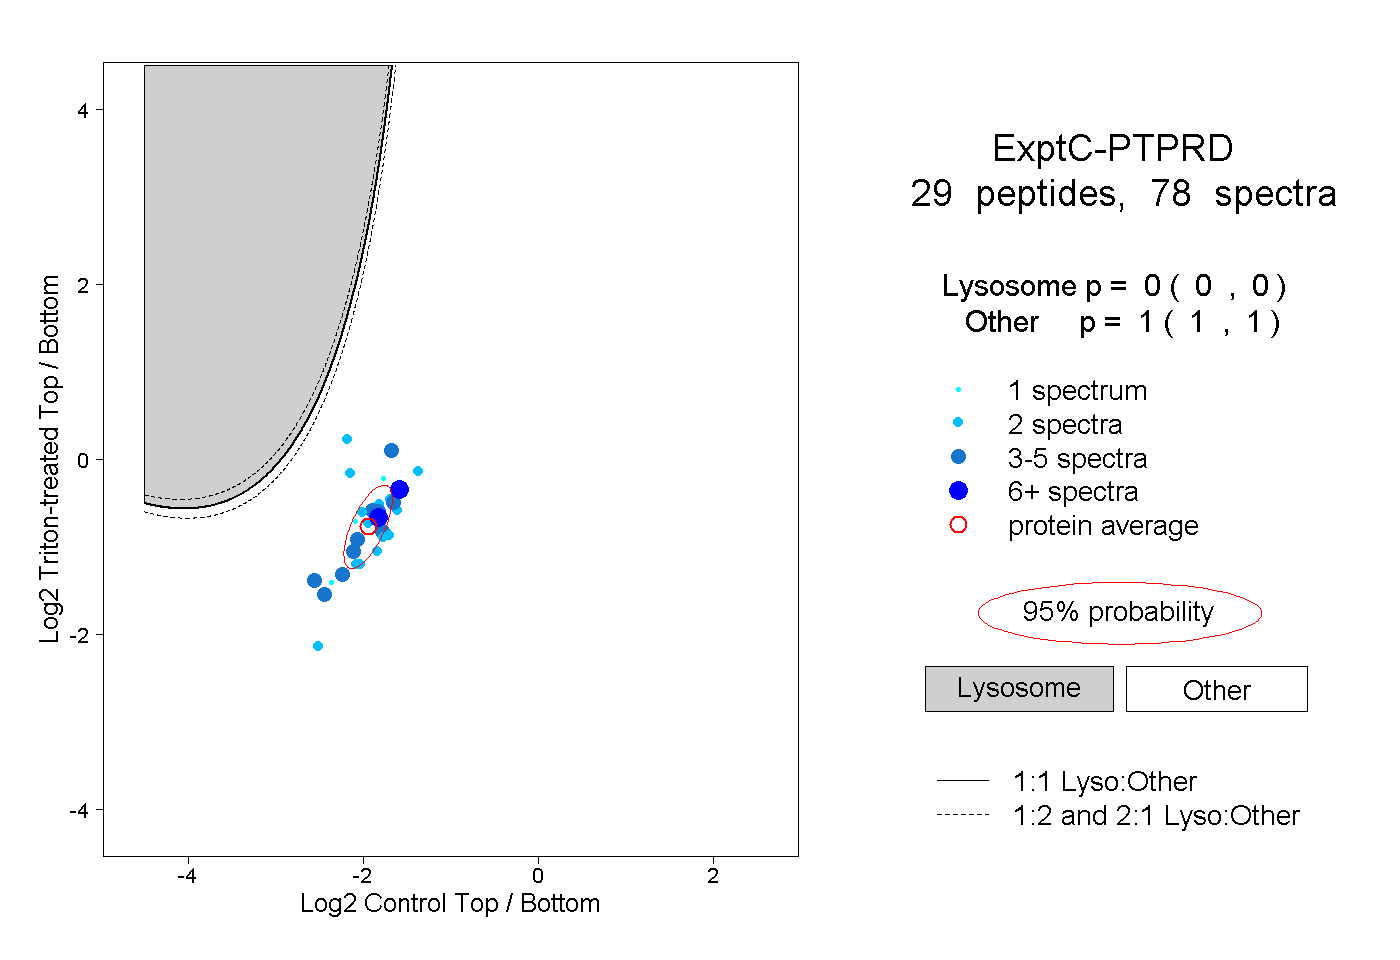 |
0.000 0.000 | 0.000 |
1.000 1.000 | 1.000 |
||||||||
| Plot | Lyso | Other | |||||||||||
| Expt D |
10 peptides |
15 spectra |
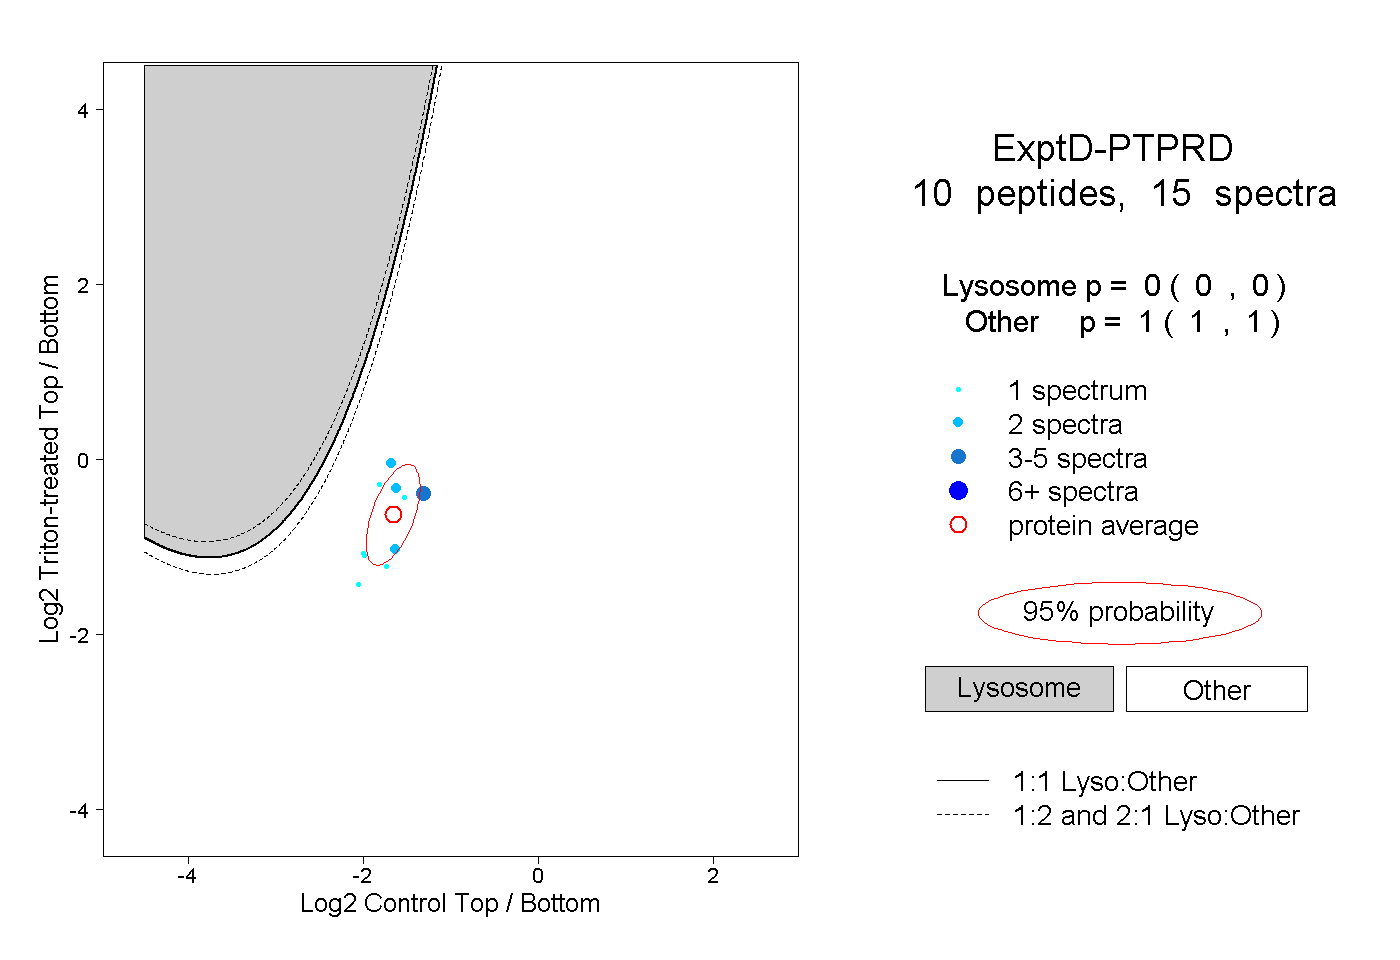 |
0.000 0.000 | 0.000 |
1.000 1.000 | 1.000 |