 6
6peptides
spectra
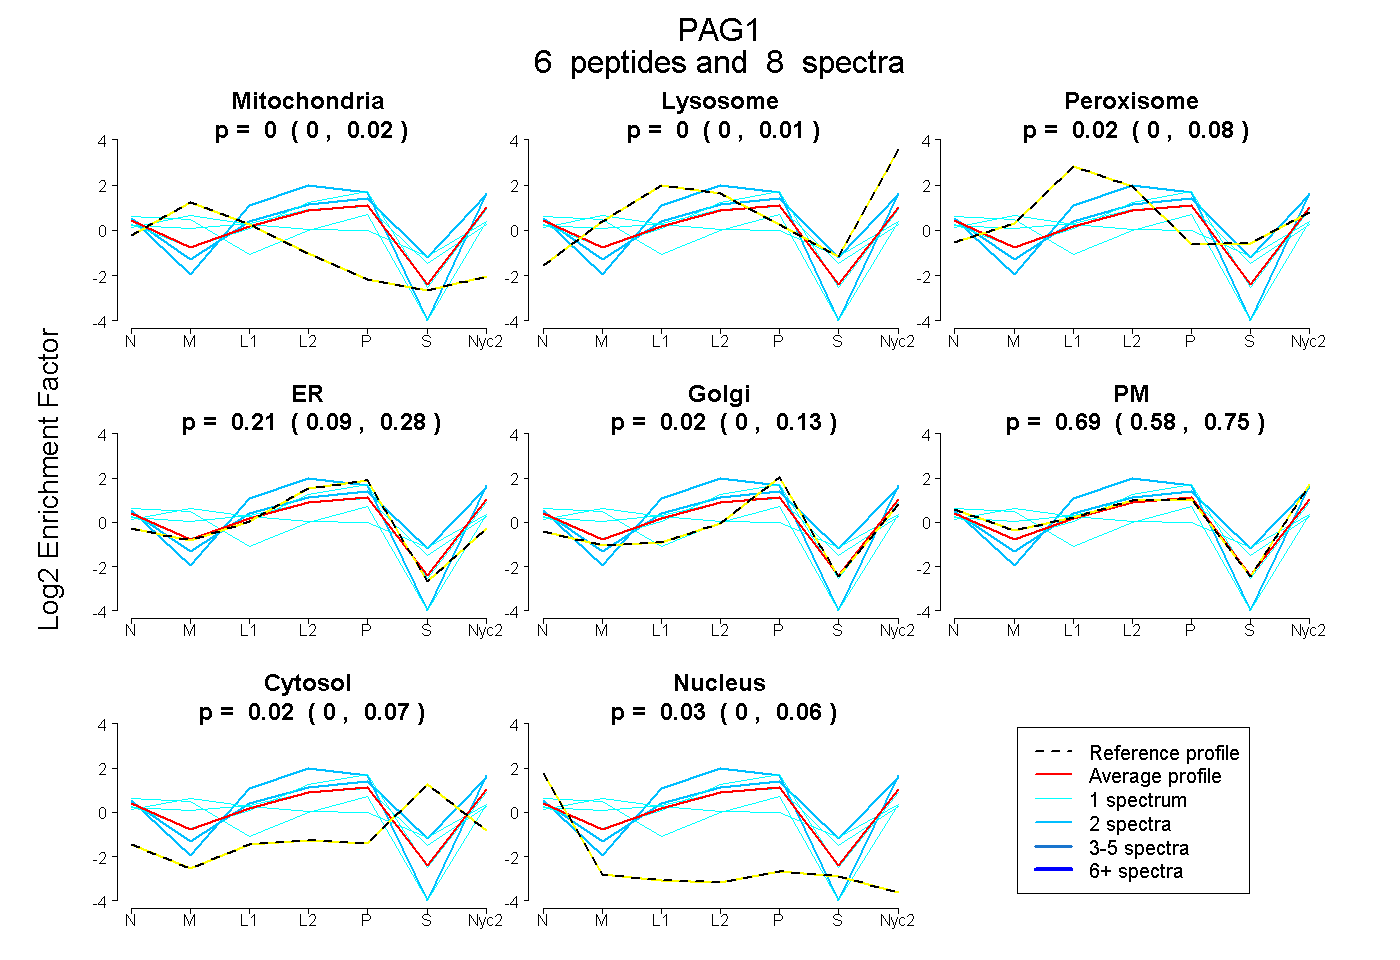
0.000 | 0.023
0.000 | 0.006
0.000 | 0.081
0.085 | 0.283
0.000 | 0.131
0.584 | 0.748
0.000 | 0.074
0.000 | 0.057
2peptides
spectra
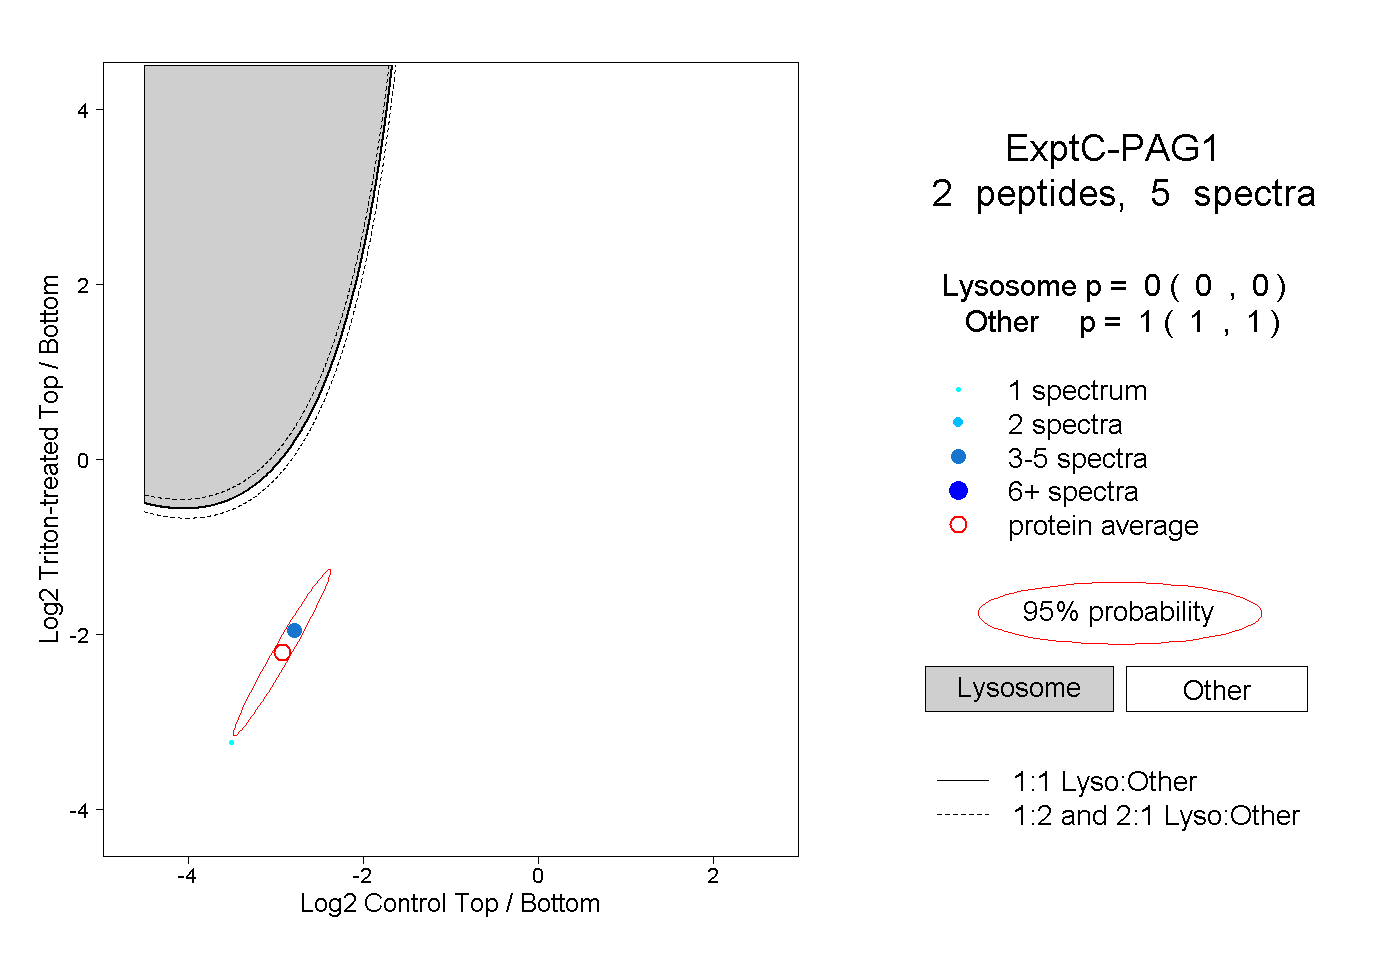
0.000 | 0.000
1.000 | 1.000
1peptide
spectra
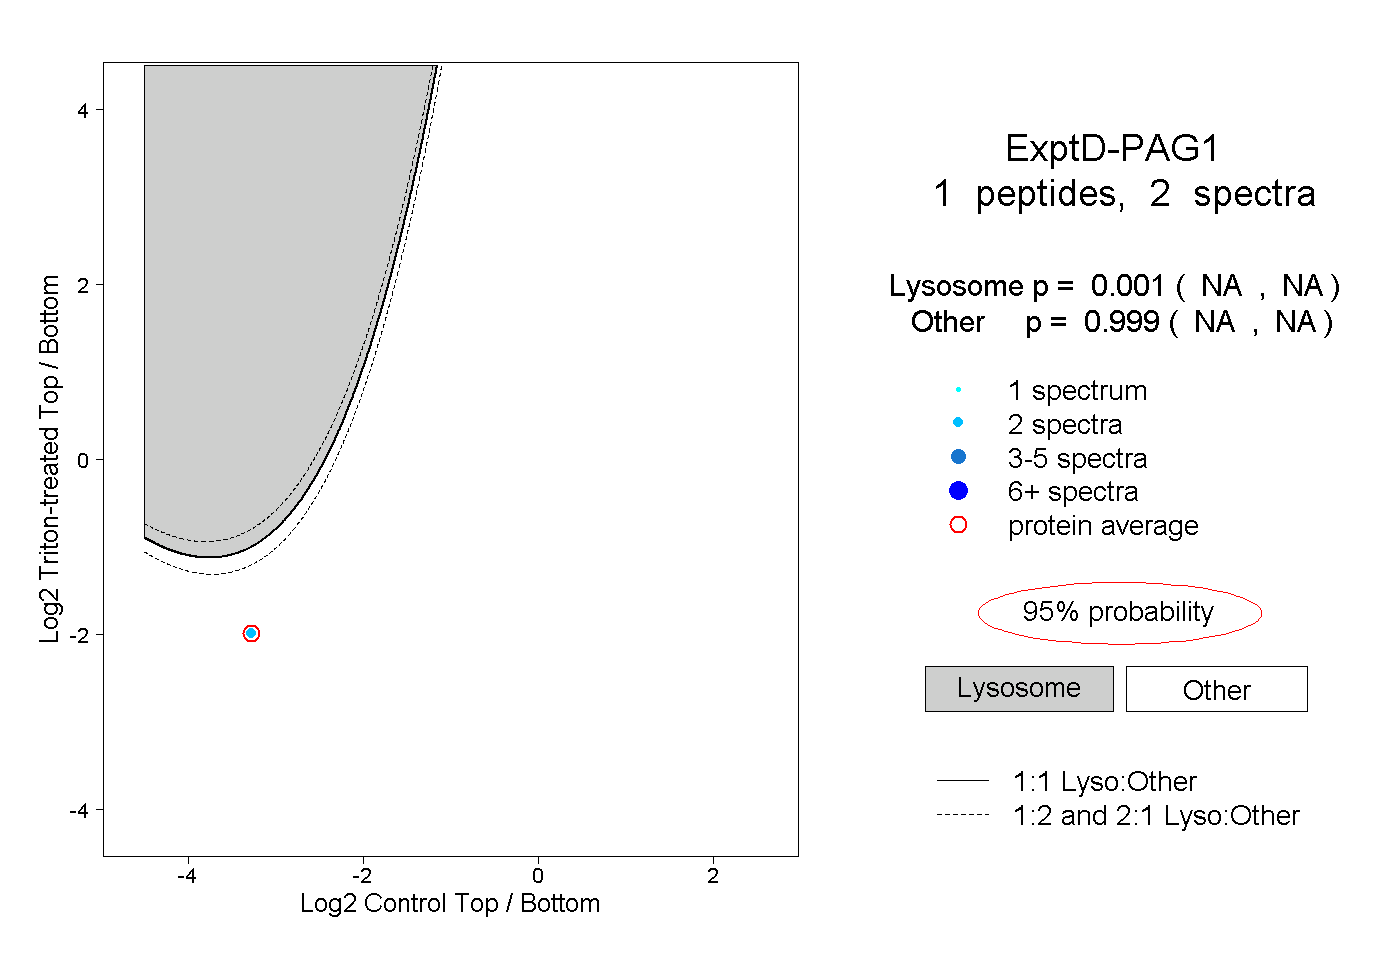
NA | NA
NA | NA