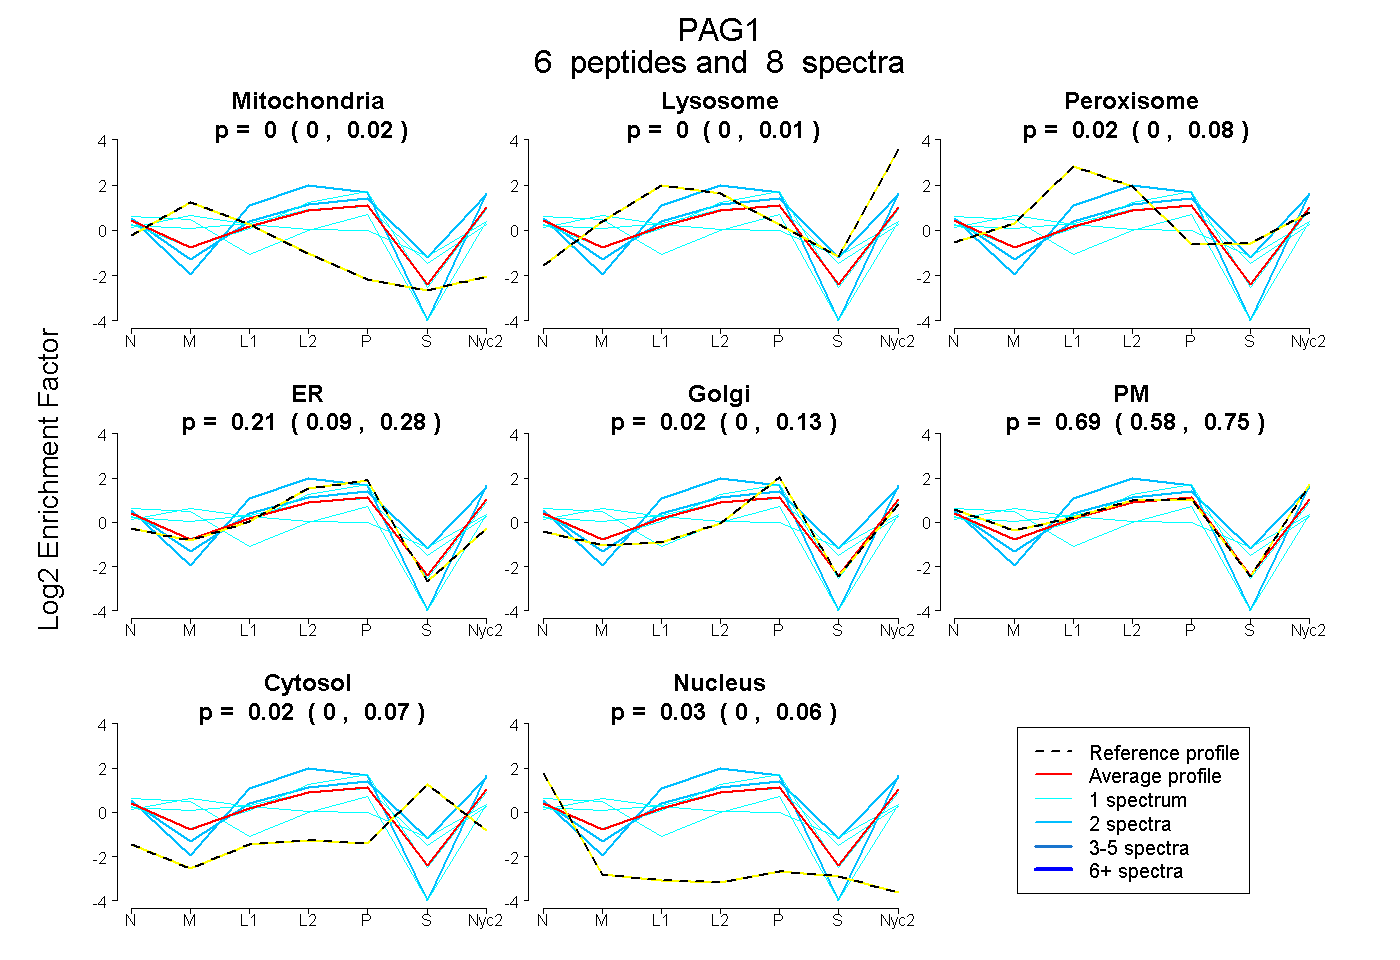
 6
6peptides
spectra
0.000 | 0.023
0.000 | 0.006
0.000 | 0.081
0.085 | 0.283
0.000 | 0.131
0.584 | 0.748
0.000 | 0.074
0.000 | 0.057
| Plot | Mito | Lyso | Perox | ER | Golgi | PM | Cytosol | Nucleus | |||||
| Expt A |
6 peptides |
8 spectra |
|
0.000 0.000 | 0.023 |
0.000 0.000 | 0.006 |
0.024 0.000 | 0.081 |
0.210 0.085 | 0.283 |
0.025 0.000 | 0.131 |
0.689 0.584 | 0.748 |
0.019 0.000 | 0.074 |
0.033 0.000 | 0.057 |
| 1 spectrum, ELQGAHAEGK | 0.077 | 0.000 | 0.204 | 0.282 | 0.138 | 0.257 | 0.042 | 0.000 | ||
| 1 spectrum, IPPENAVDAMLTAR | 0.000 | 0.000 | 0.000 | 0.418 | 0.076 | 0.506 | 0.000 | 0.000 | ||
| 1 spectrum, TPNSISMLPPAR | 0.284 | 0.070 | 0.109 | 0.000 | 0.013 | 0.403 | 0.121 | 0.000 | ||
| 1 spectrum, RPGEEPEPDYEAIQTLNR | 0.218 | 0.000 | 0.000 | 0.000 | 0.301 | 0.418 | 0.000 | 0.063 | ||
| 2 spectra, ADFAEYASVDR | 0.000 | 0.081 | 0.014 | 0.101 | 0.000 | 0.684 | 0.120 | 0.000 | ||
| 2 spectra, AADGDSGPGVEGPYEVLK | 0.000 | 0.000 | 0.000 | 0.352 | 0.000 | 0.648 | 0.000 | 0.000 |
| Plot | Lyso | Other | |||||||||||
| Expt C |
2 peptides |
5 spectra |
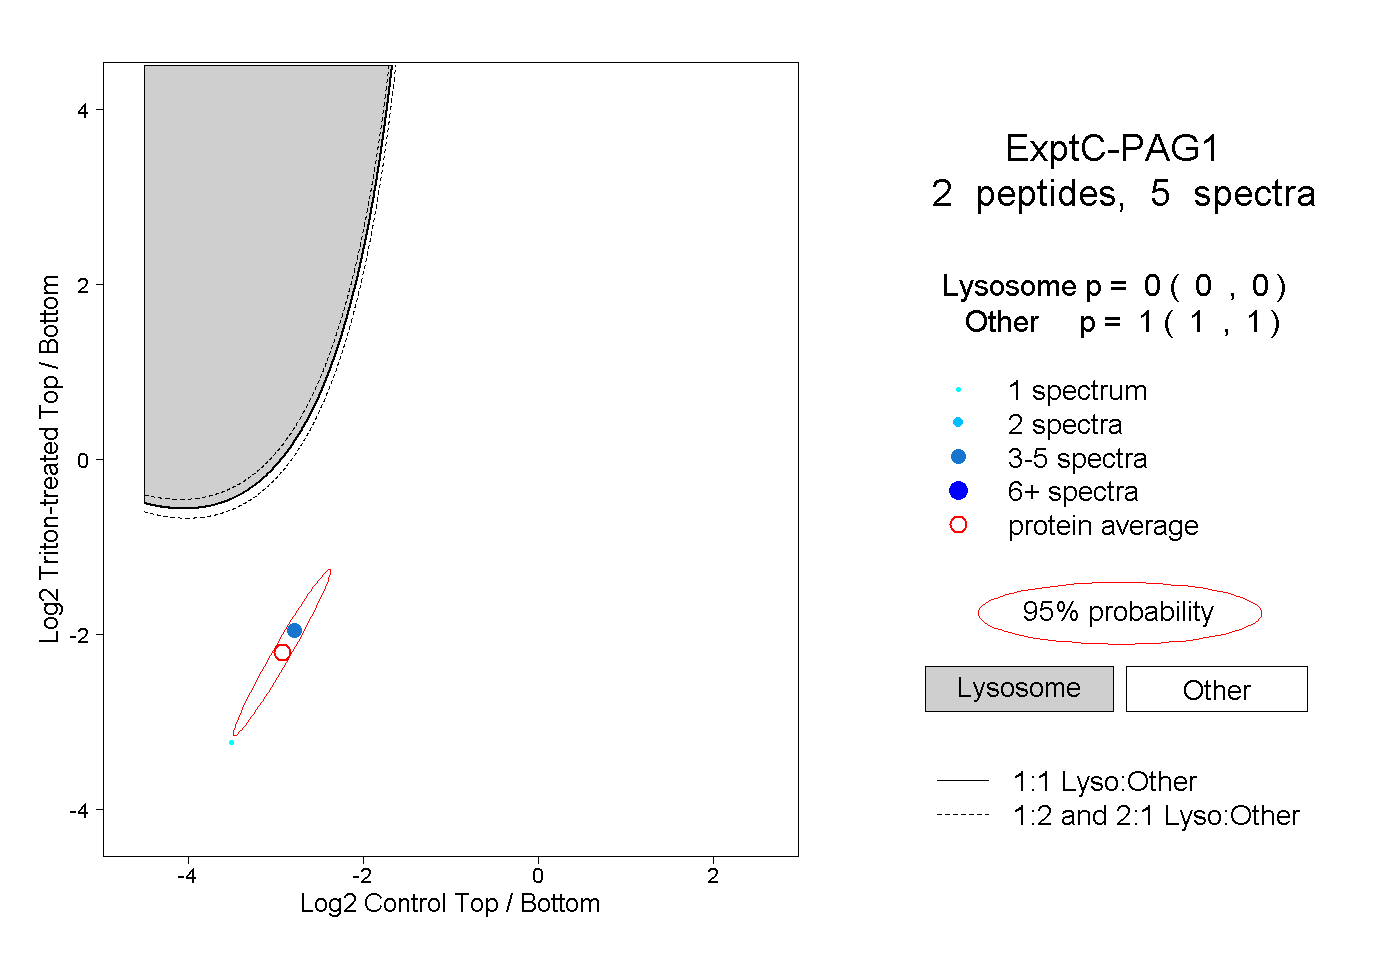 |
0.000 0.000 | 0.000 |
1.000 1.000 | 1.000 |
||||||||
| Plot | Lyso | Other | |||||||||||
| Expt D |
1 peptide |
2 spectra |
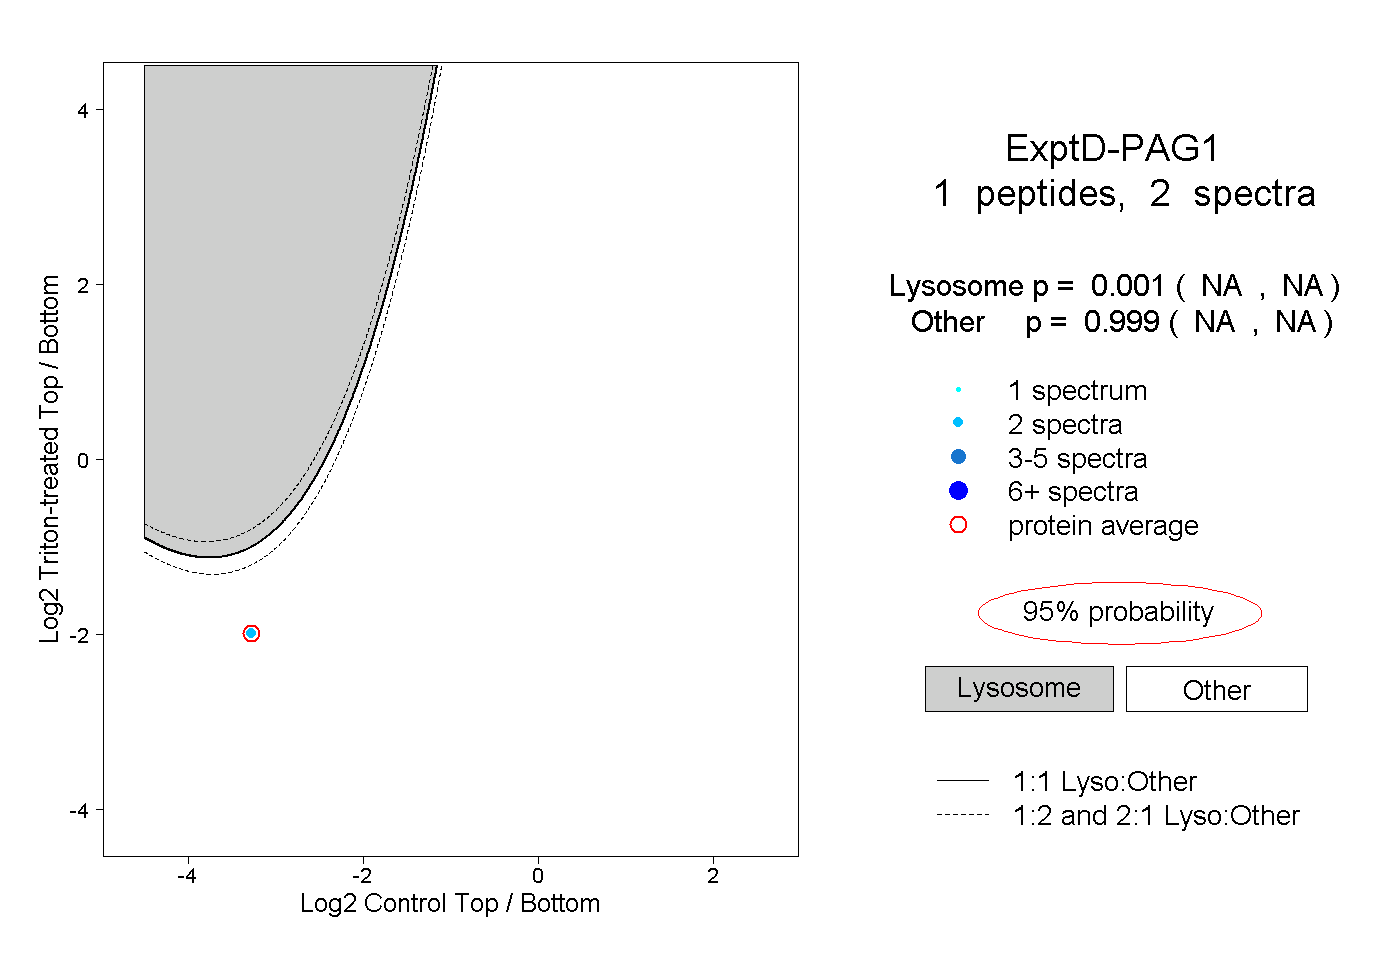 |
0.001 NA | NA |
0.999 NA | NA |