 7
7peptides
spectra
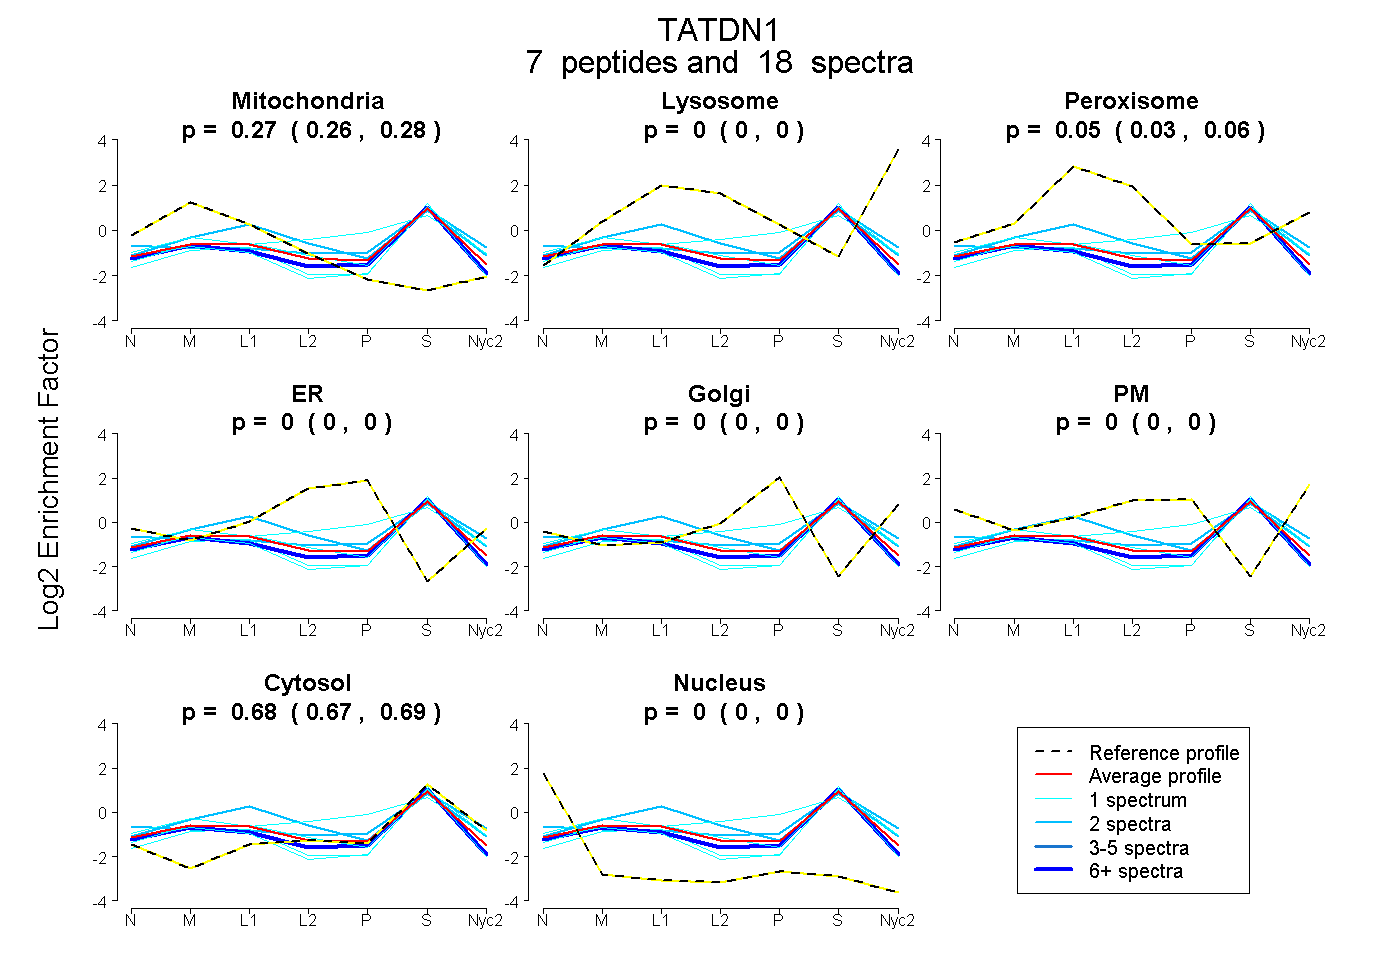
0.256 | 0.283
0.000 | 0.000
0.030 | 0.064
0.000 | 0.000
0.000 | 0.000
0.000 | 0.000
0.672 | 0.689
0.000 | 0.000
1peptide
spectrum

NA | NA
NA | NA
NA | NA
NA | NA
NA | NA
NA | NA
NA | NA
8peptides
spectra
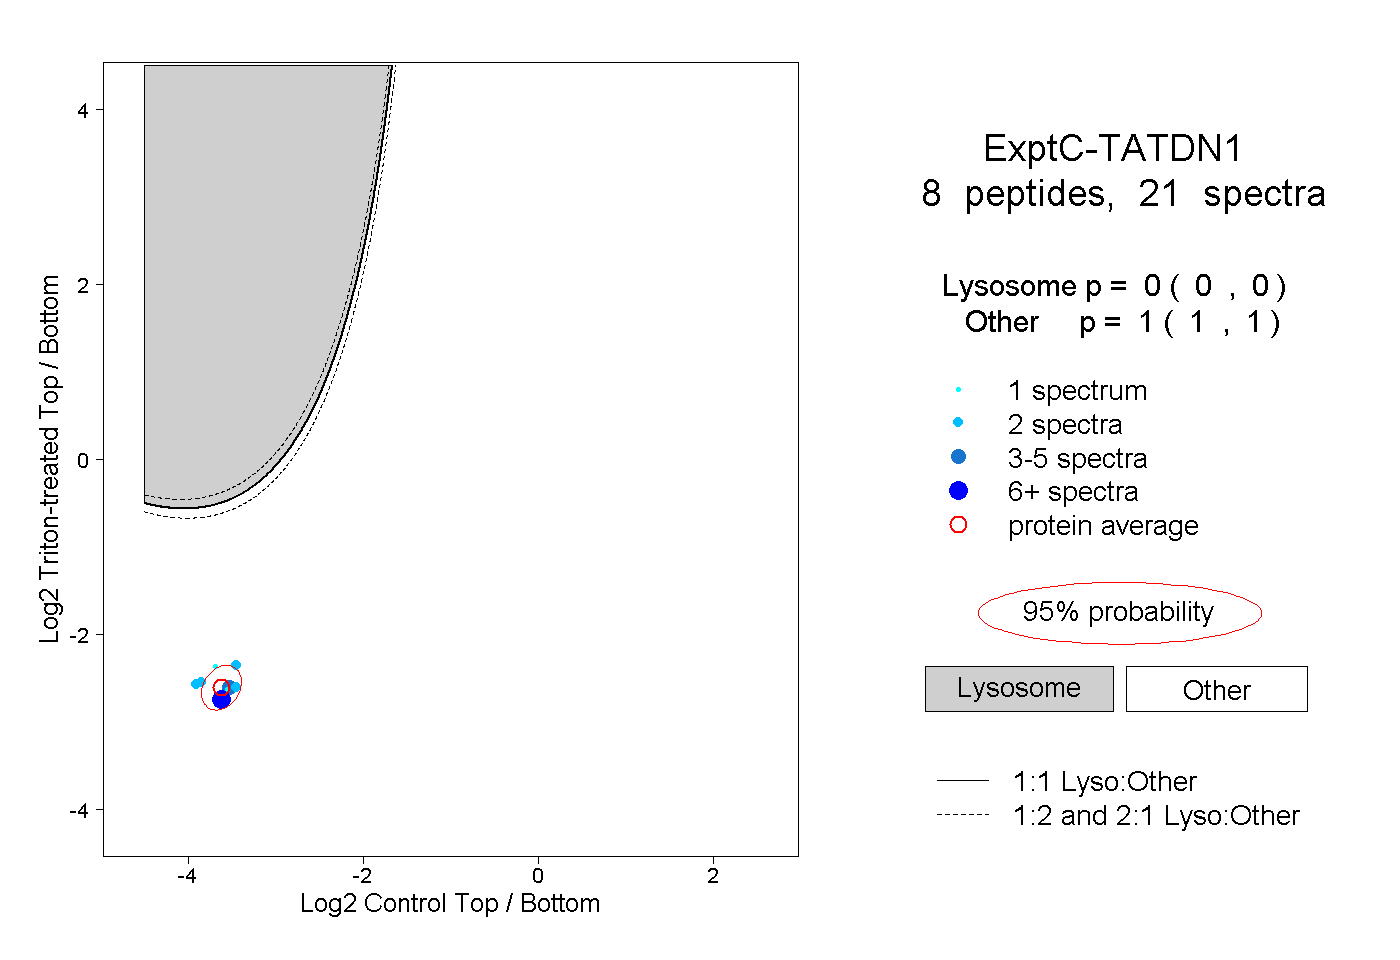
0.000 | 0.000
1.000 | 1.000
1peptide
spectrum
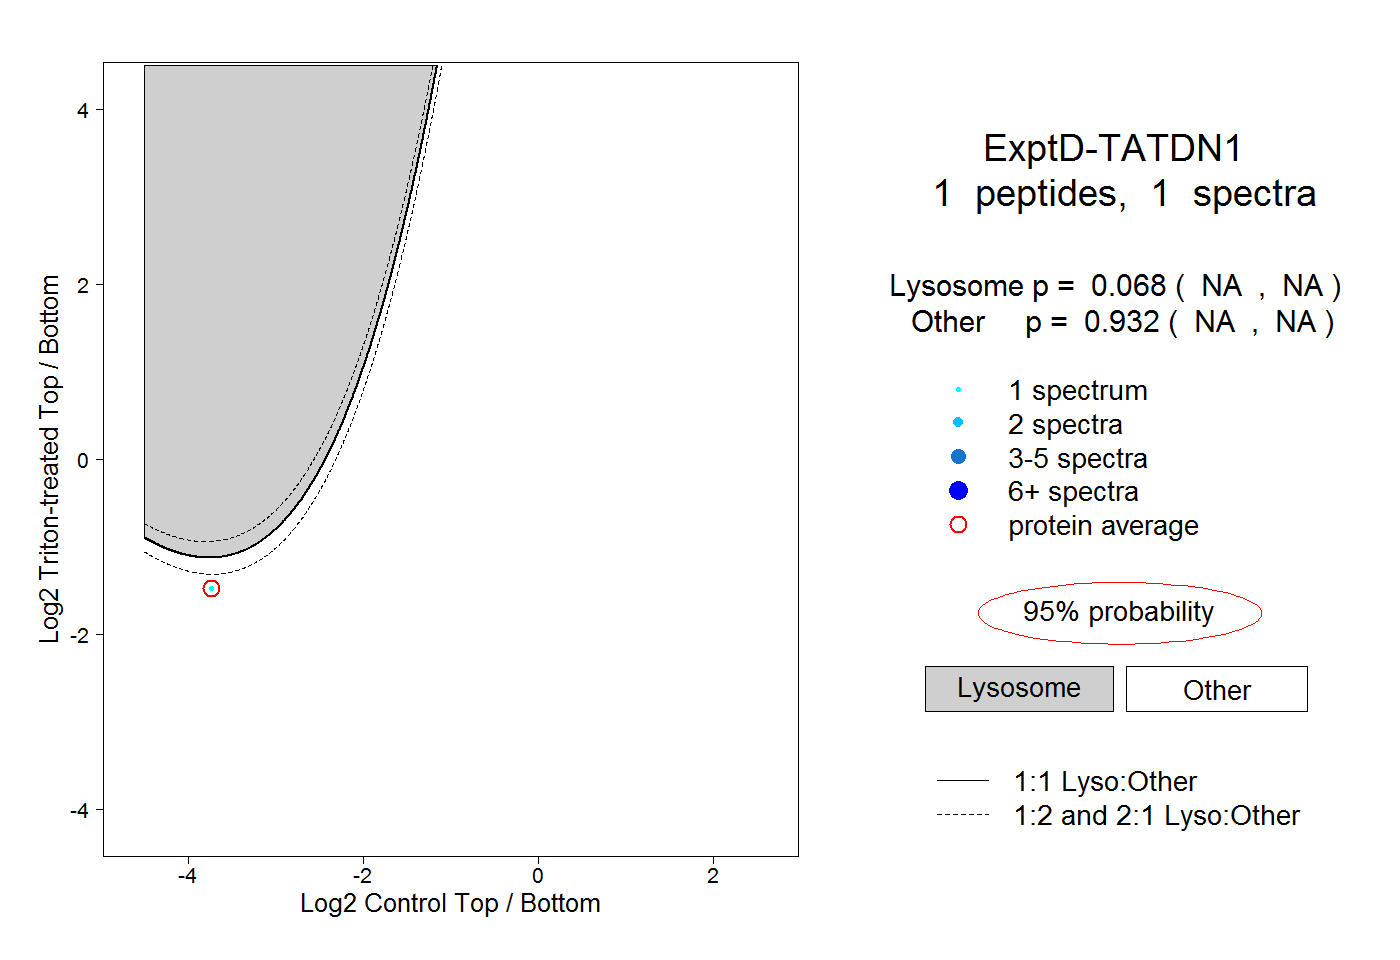
NA | NA
NA | NA