 7
7peptides
spectra
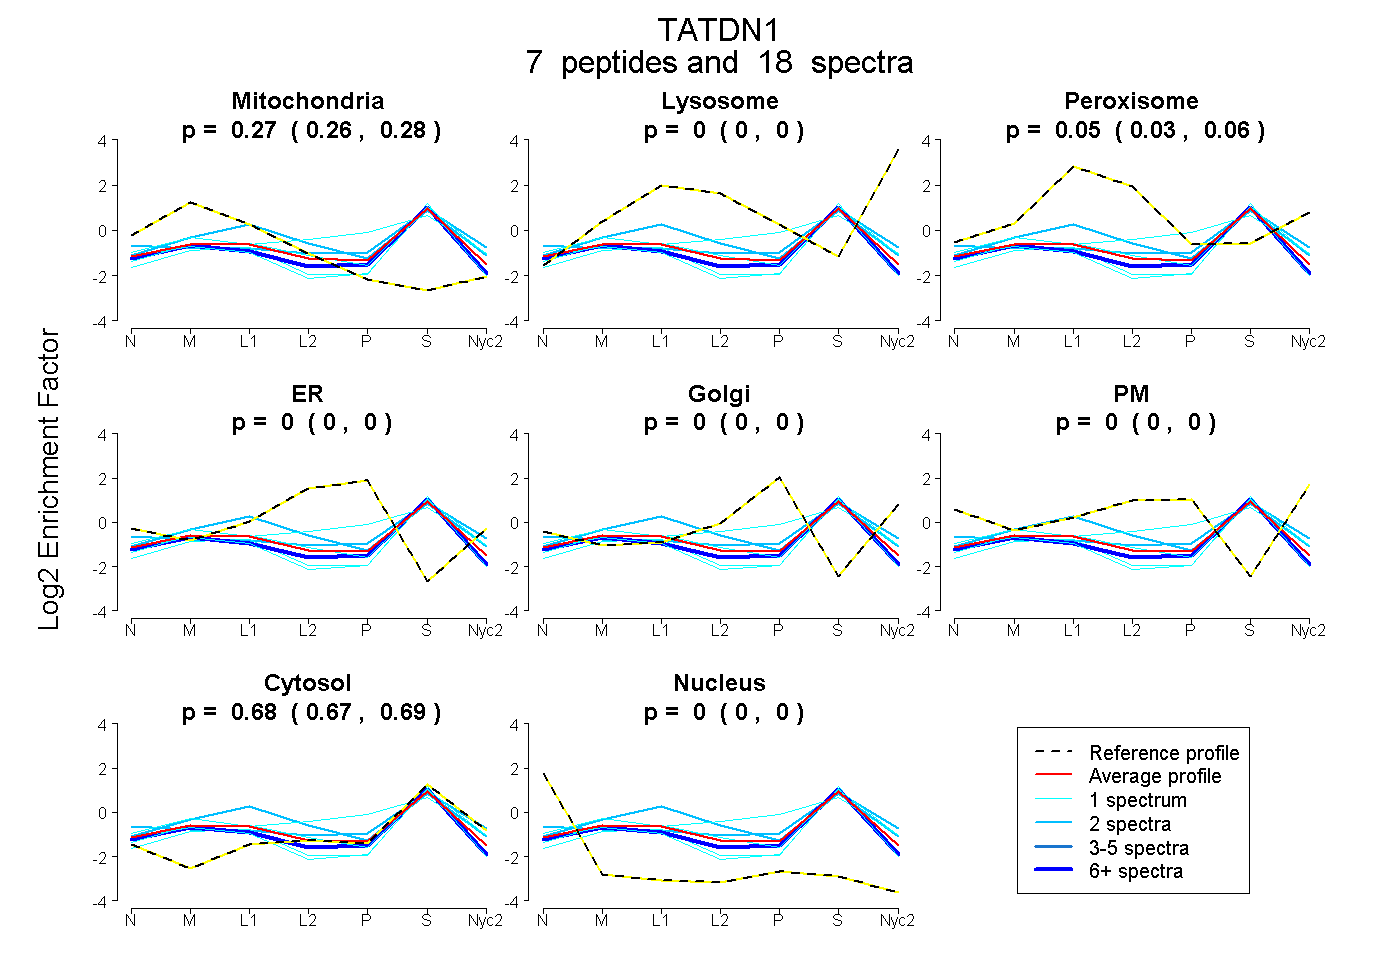
0.256 | 0.283
0.000 | 0.000
0.030 | 0.064
0.000 | 0.000
0.000 | 0.000
0.000 | 0.000
0.672 | 0.689
0.000 | 0.000
| Plot | Mito | Lyso | Perox | ER | Golgi | PM | Cytosol | Nucleus | |||||
| Expt A |
7 peptides |
18 spectra |
|
0.271 0.256 | 0.283 |
0.000 0.000 | 0.000 |
0.049 0.030 | 0.064 |
0.000 0.000 | 0.000 |
0.000 0.000 | 0.000 |
0.000 0.000 | 0.000 |
0.681 0.672 | 0.689 |
0.000 0.000 | 0.000 |
| 1 spectrum, NSHTEFLDIMR | 0.215 | 0.000 | 0.097 | 0.000 | 0.000 | 0.000 | 0.688 | 0.000 | ||
| 1 spectrum, LMIETDAPWCGVK | 0.252 | 0.000 | 0.000 | 0.000 | 0.000 | 0.000 | 0.748 | 0.000 | ||
| 2 spectra, LQFCPK | 0.201 | 0.000 | 0.263 | 0.000 | 0.000 | 0.000 | 0.537 | 0.000 | ||
| 2 spectra, HQDDLQDVIGR | 0.166 | 0.000 | 0.108 | 0.000 | 0.000 | 0.044 | 0.682 | 0.000 | ||
| 1 spectrum, QFELSEQTK | 0.136 | 0.000 | 0.138 | 0.167 | 0.004 | 0.000 | 0.554 | 0.000 | ||
| 1 spectrum, VVAIGECGLDFDR | 0.289 | 0.000 | 0.000 | 0.000 | 0.000 | 0.000 | 0.706 | 0.006 | ||
| 10 spectra, LPMFLHCR | 0.288 | 0.000 | 0.000 | 0.000 | 0.000 | 0.000 | 0.712 | 0.000 |
| Plot | Mito | Lyso or Perox | ER | Golgi | PM | Cytosol | Nucleus | ||||||
| Expt B |
1 peptide |
1 spectrum |
 |
0.181 NA | NA |
0.000 NA | NA |
0.000 NA | NA |
0.000 NA | NA |
0.000 NA | NA |
0.760 NA | NA |
0.059 NA | NA |
|||
| Plot | Lyso | Other | |||||||||||
| Expt C |
8 peptides |
21 spectra |
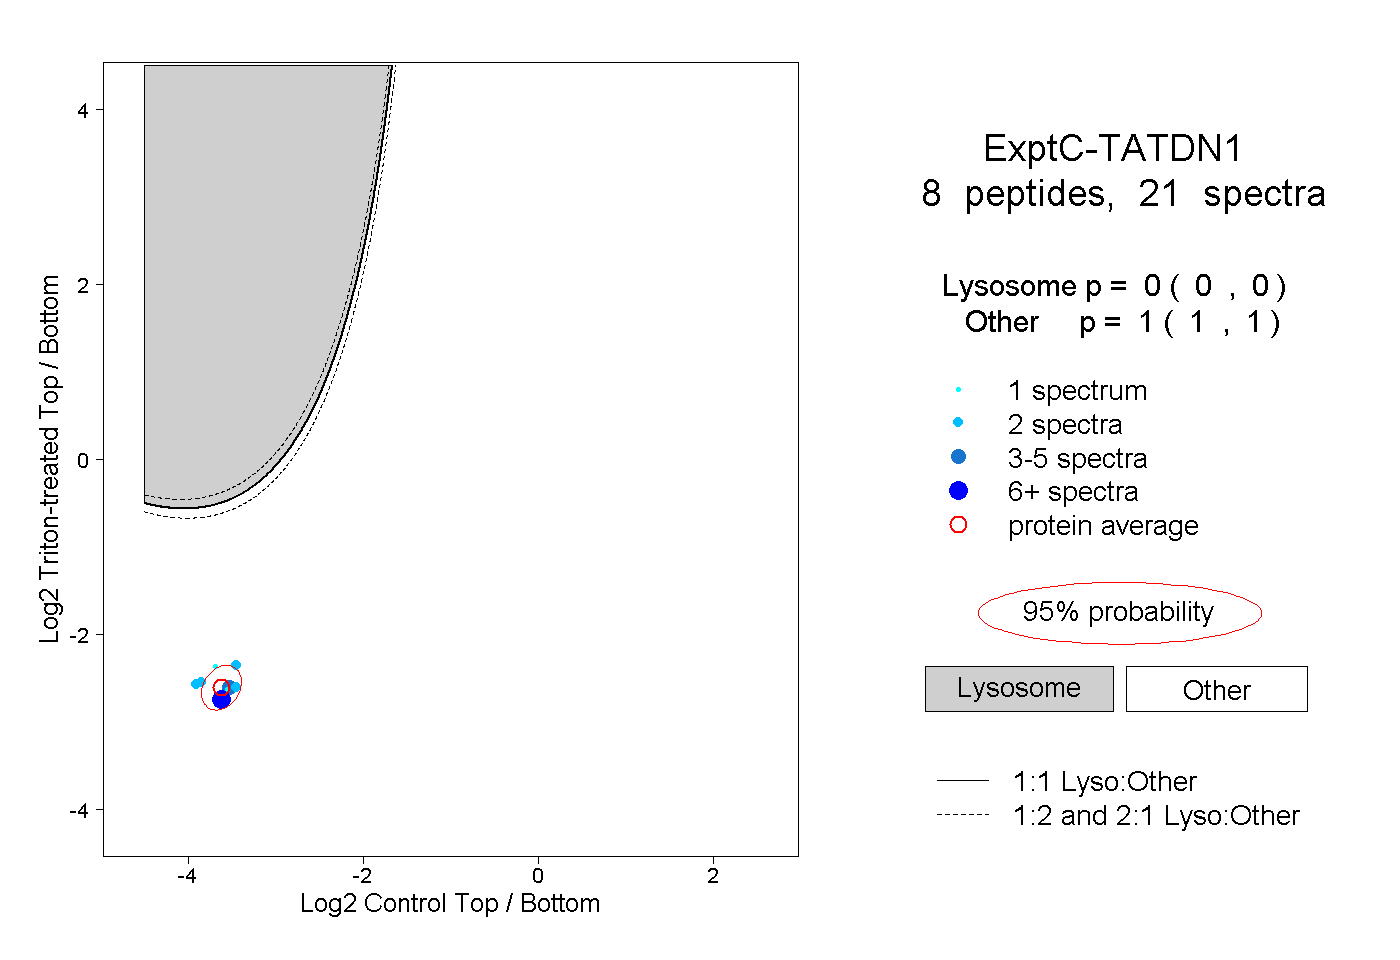 |
0.000 0.000 | 0.000 |
1.000 1.000 | 1.000 |
||||||||
| Plot | Lyso | Other | |||||||||||
| Expt D |
1 peptide |
1 spectrum |
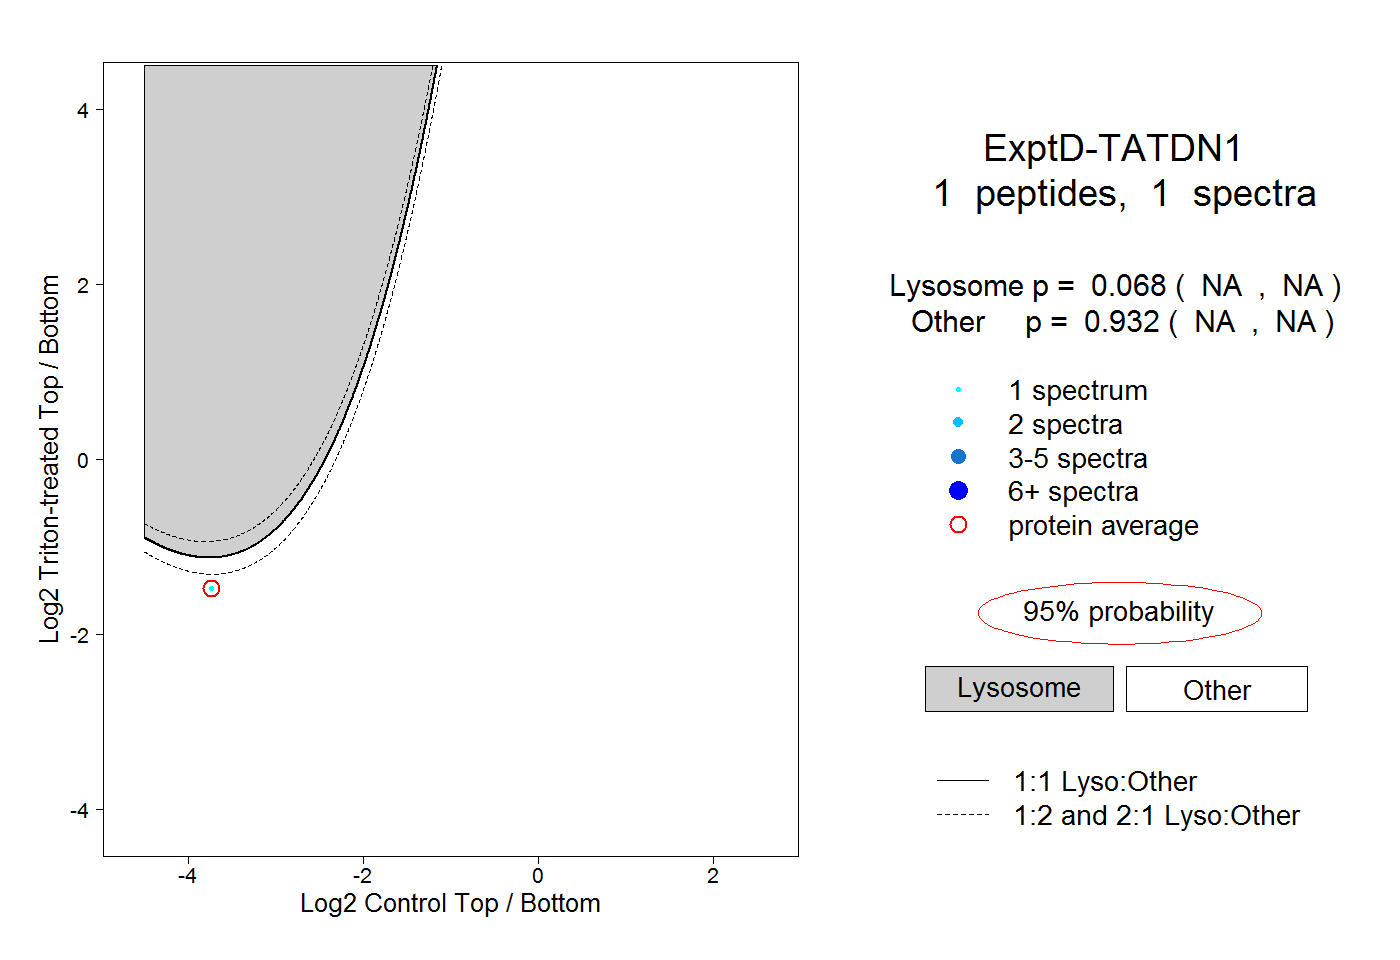 |
0.068 NA | NA |
0.932 NA | NA |