 4
4peptides
spectra
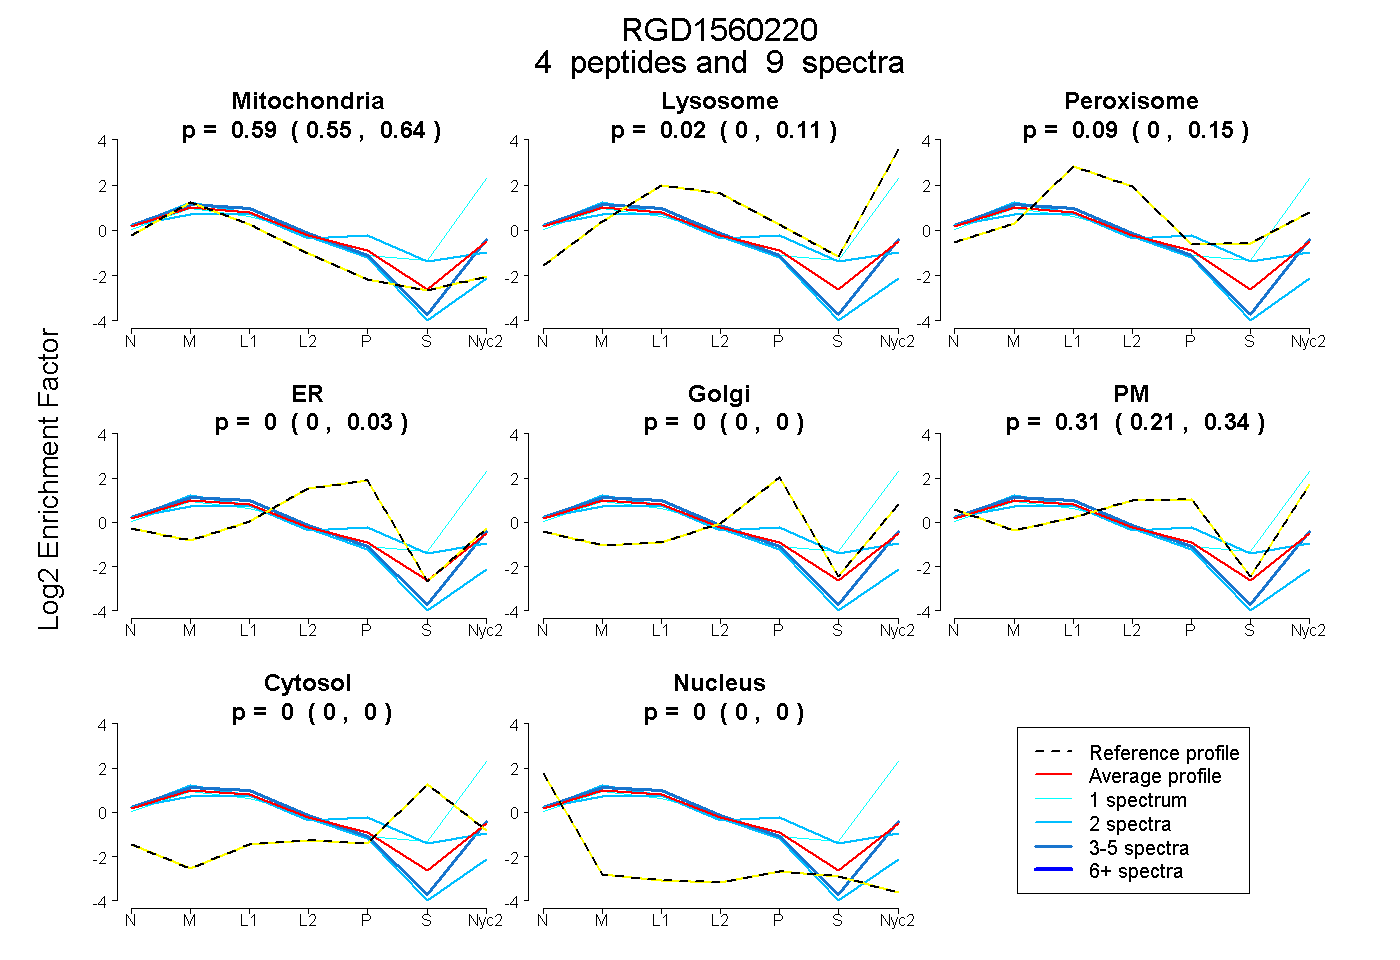
0.550 | 0.636
0.000 | 0.113
0.000 | 0.148
0.000 | 0.030
0.000 | 0.000
0.208 | 0.337
0.000 | 0.000
0.000 | 0.000
1peptide
spectrum
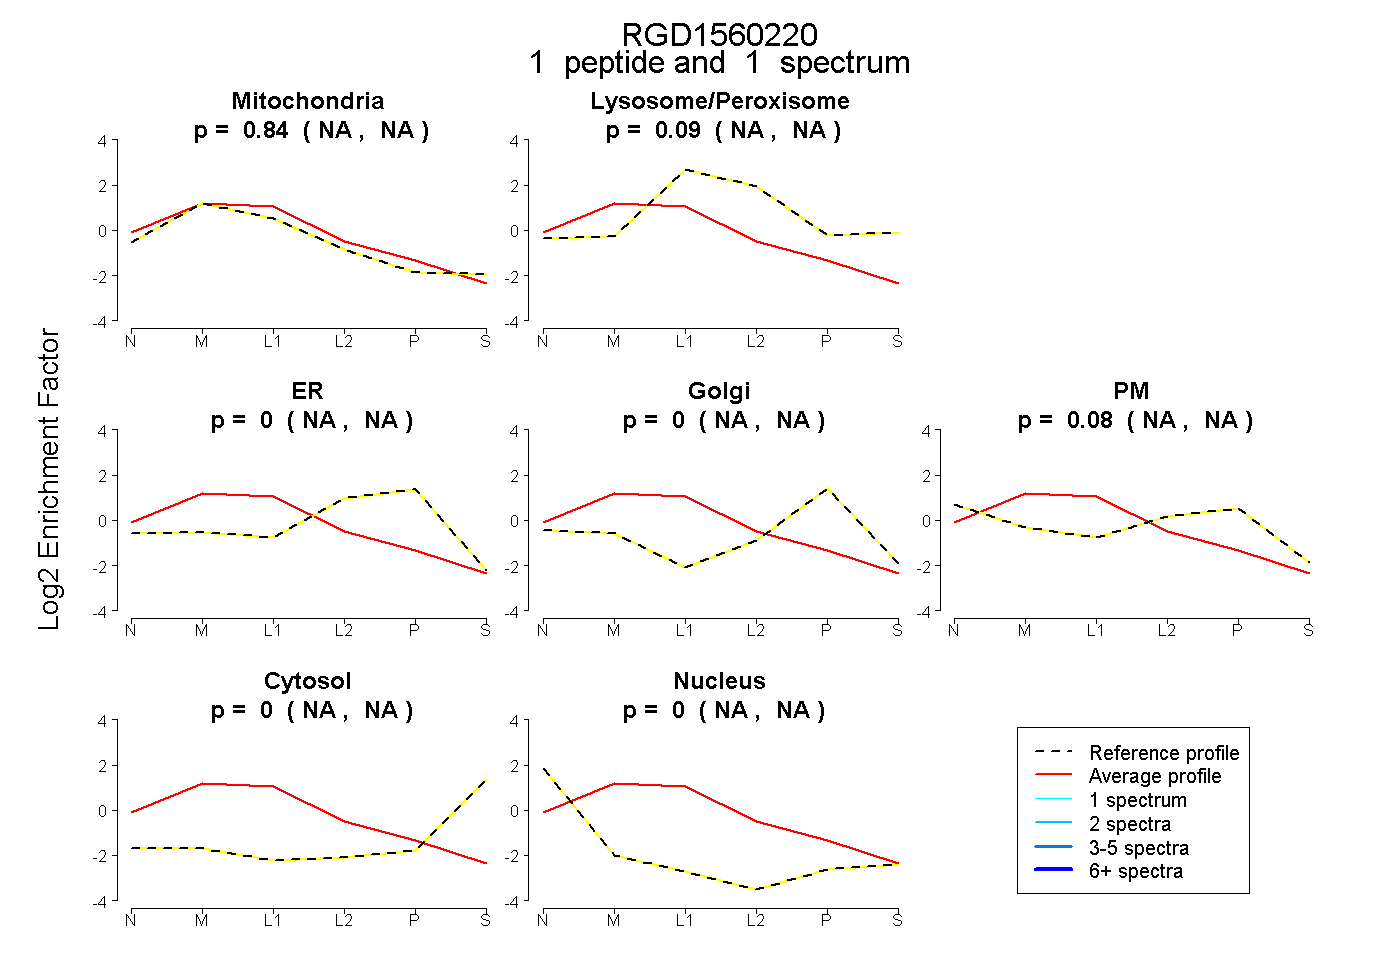
NA | NA
NA | NA
NA | NA
NA | NA
NA | NA
NA | NA
NA | NA
6peptides
spectra
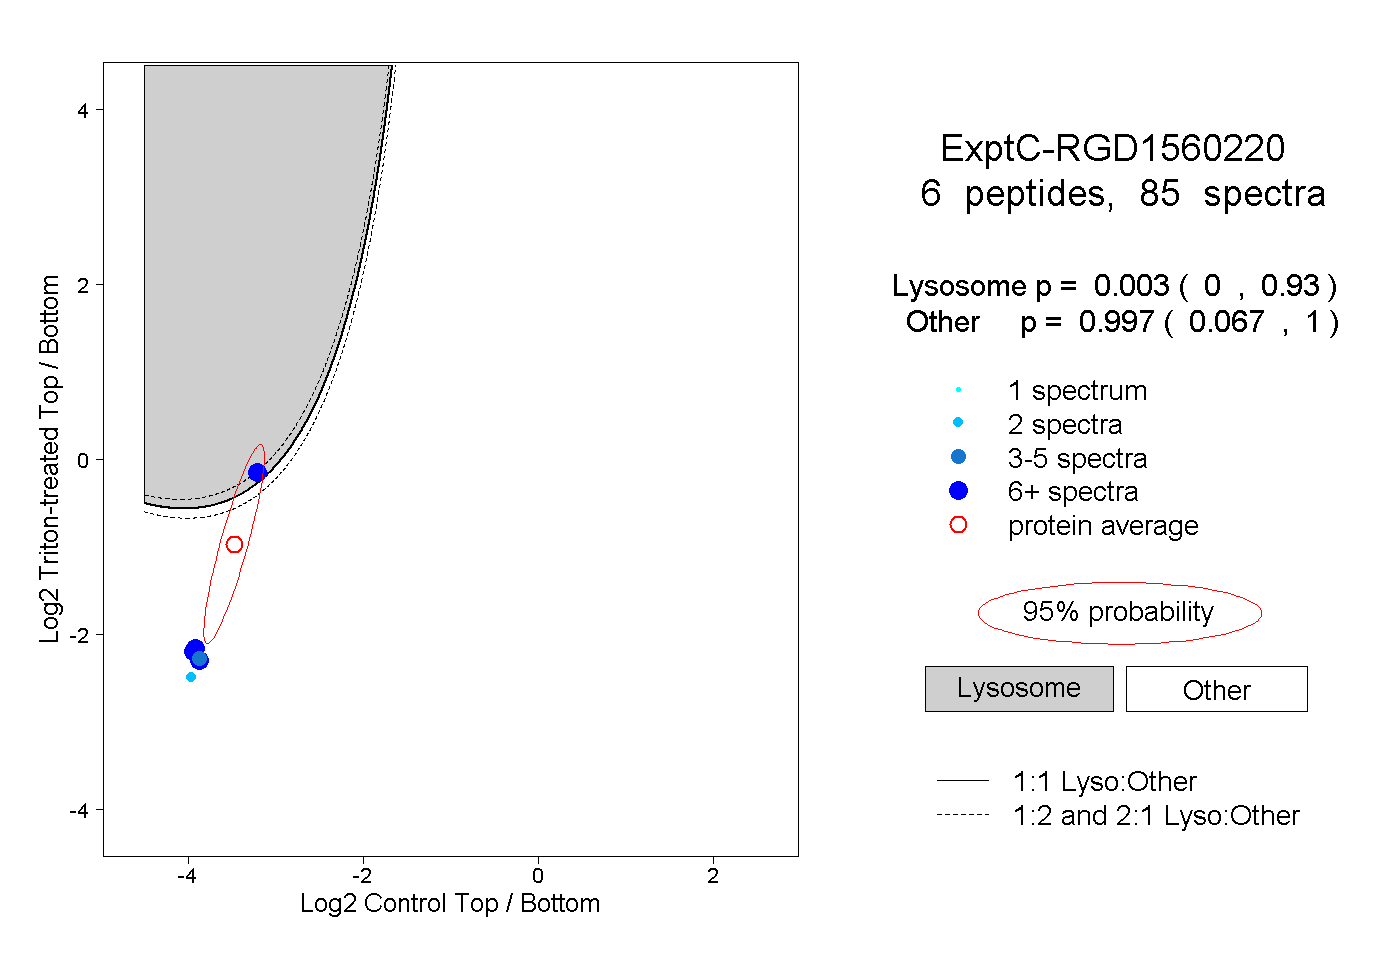
0.000 | 0.930
0.067 | 1.000
2peptides
spectra
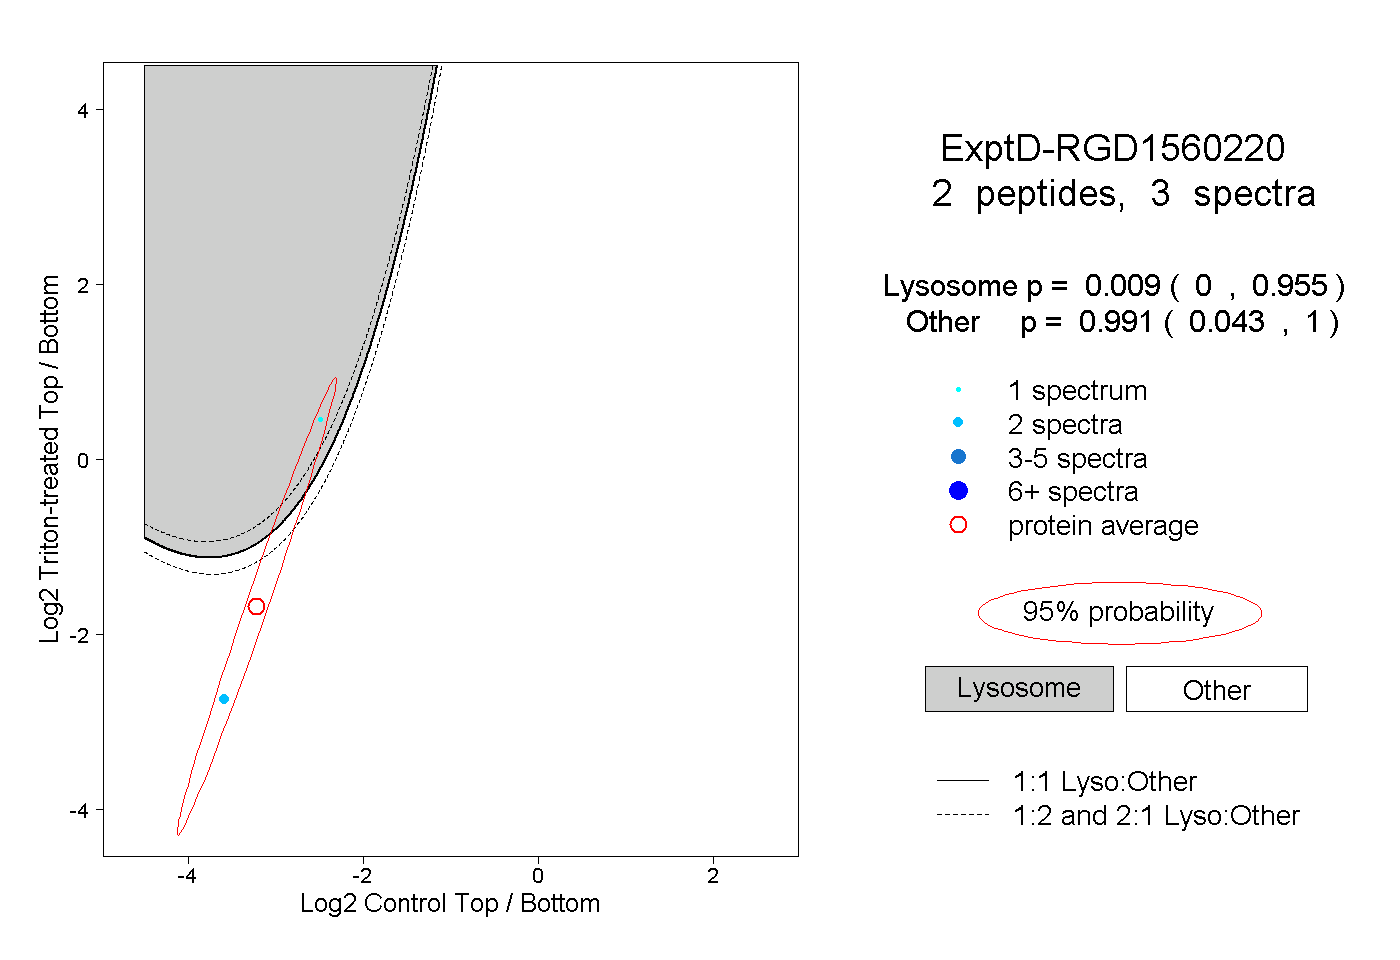
0.000 | 0.955
0.043 | 1.000