 4
4peptides
spectra
0.550 | 0.636
0.000 | 0.113
0.000 | 0.148
0.000 | 0.030
0.000 | 0.000
0.208 | 0.337
0.000 | 0.000
0.000 | 0.000
| Plot | Mito | Lyso | Perox | ER | Golgi | PM | Cytosol | Nucleus | |||||
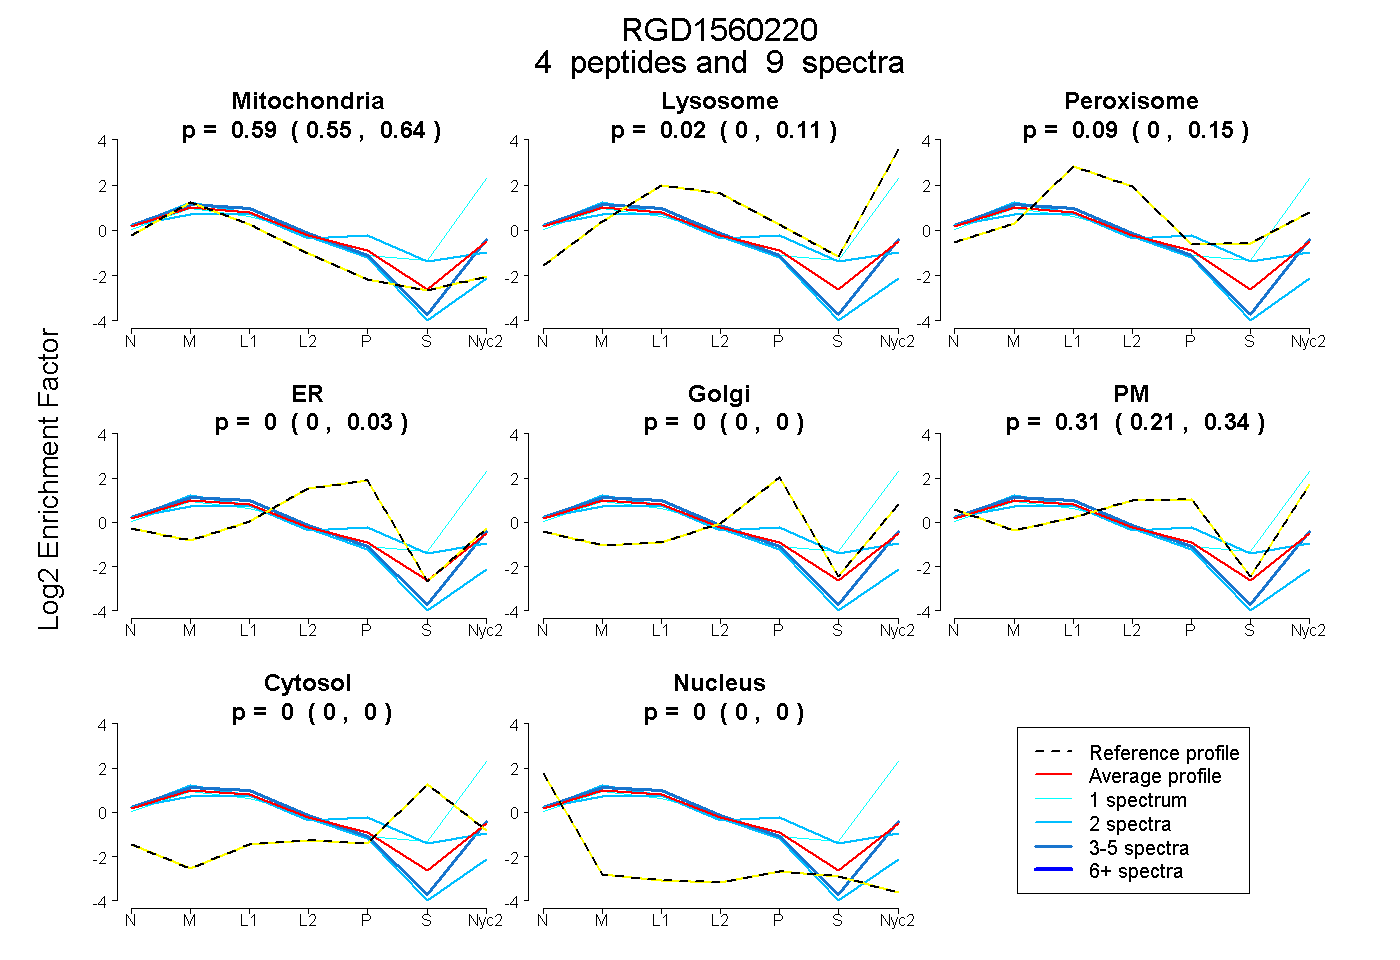
| Expt A |
4 peptides |
9 spectra |
|
0.592 0.550 | 0.636 |
0.017 0.000 | 0.113 |
0.086 0.000 | 0.148 |
0.000 0.000 | 0.030 |
0.000 0.000 | 0.000 |
0.305 0.208 | 0.337 |
0.000 0.000 | 0.000 |
0.000 0.000 | 0.000 |
| 2 spectra, EAALILGVSPTANK | 0.814 | 0.000 | 0.000 | 0.186 | 0.000 | 0.000 | 0.000 | 0.000 | ||
| 1 spectrum, GGFEPK | 0.218 | 0.661 | 0.000 | 0.000 | 0.000 | 0.000 | 0.000 | 0.122 | ||
| 2 spectra, SAFSGGYYR | 0.465 | 0.000 | 0.267 | 0.000 | 0.232 | 0.000 | 0.020 | 0.015 | ||
| 4 spectra, IMILNHPDK | 0.638 | 0.032 | 0.000 | 0.000 | 0.000 | 0.330 | 0.000 | 0.000 |
| Plot | Mito | Lyso or Perox | ER | Golgi | PM | Cytosol | Nucleus | ||||||
| Expt B |
1 peptide |
1 spectrum |
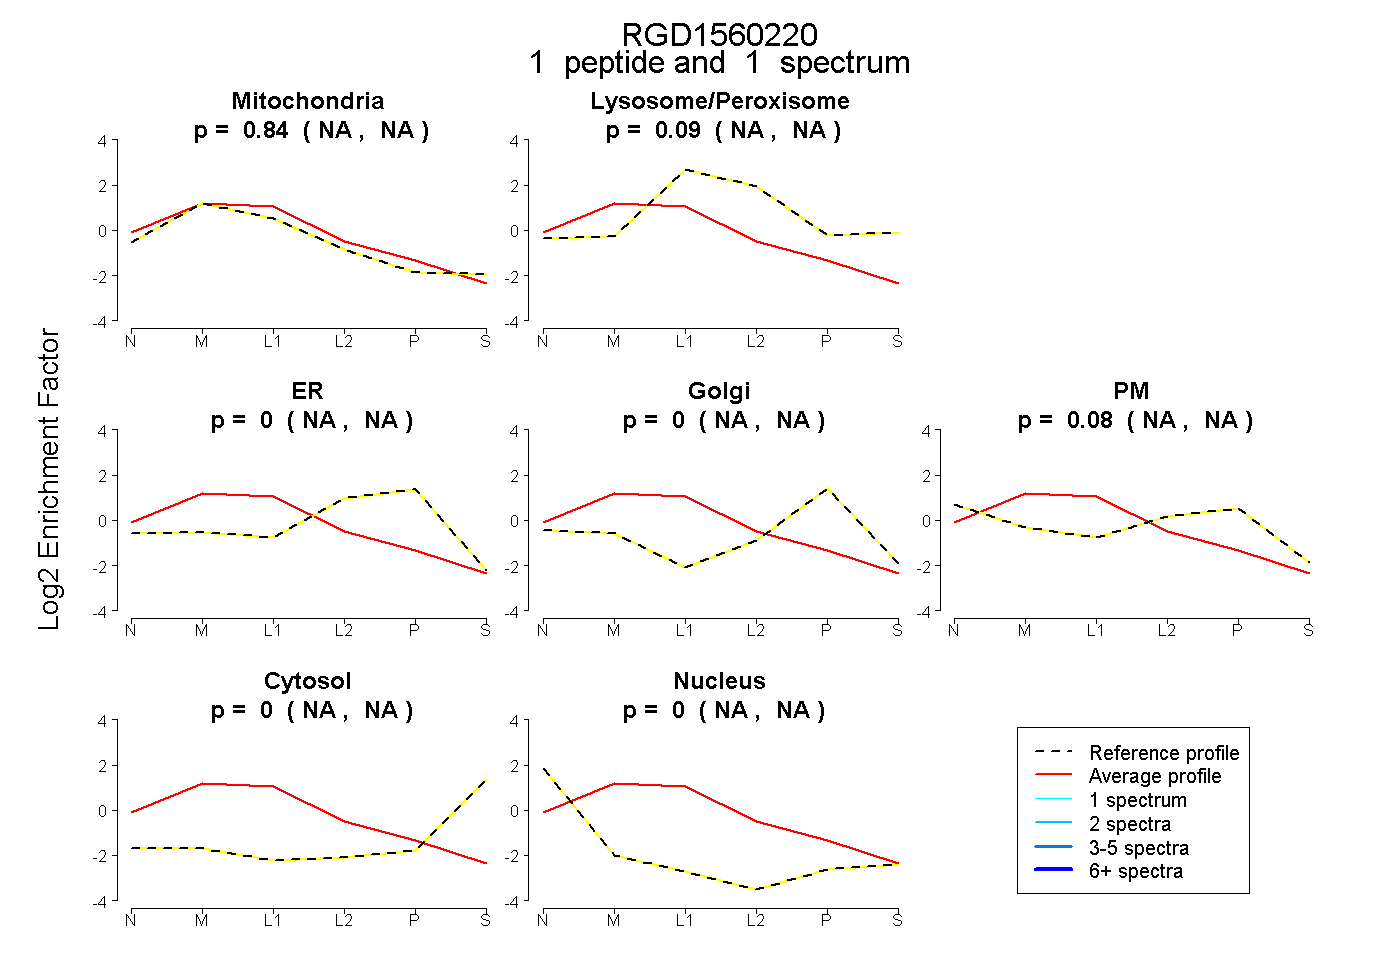 |
0.837 NA | NA |
0.085 NA | NA |
0.000 NA | NA |
0.000 NA | NA |
0.078 NA | NA |
0.000 NA | NA |
0.000 NA | NA |
|||
| Plot | Lyso | Other | |||||||||||
| Expt C |
6 peptides |
85 spectra |
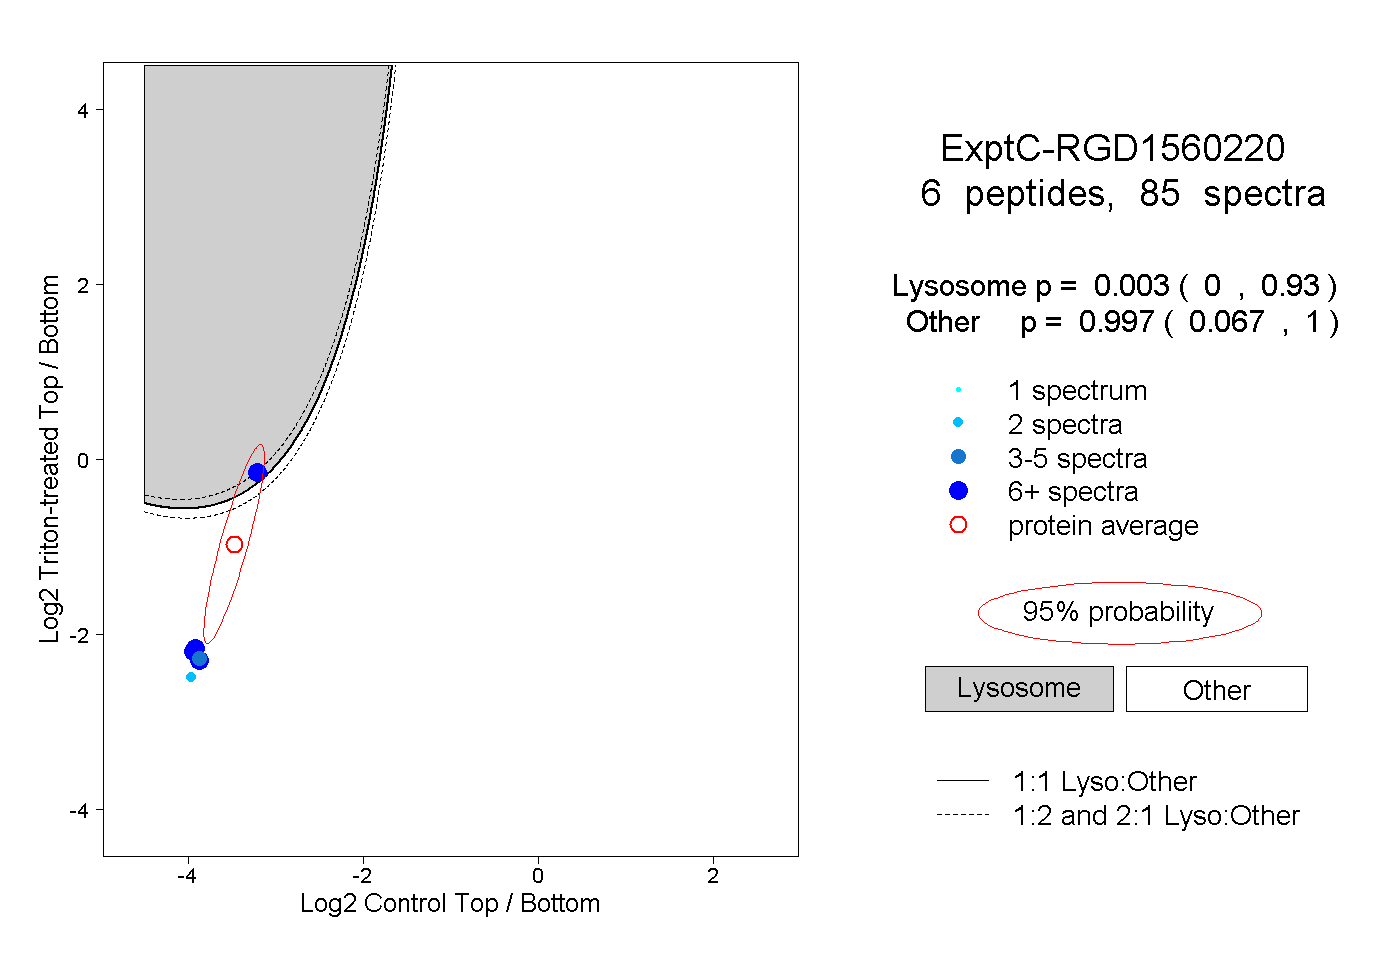 |
0.003 0.000 | 0.930 |
0.997 0.067 | 1.000 |
||||||||
| Plot | Lyso | Other | |||||||||||
| Expt D |
2 peptides |
3 spectra |
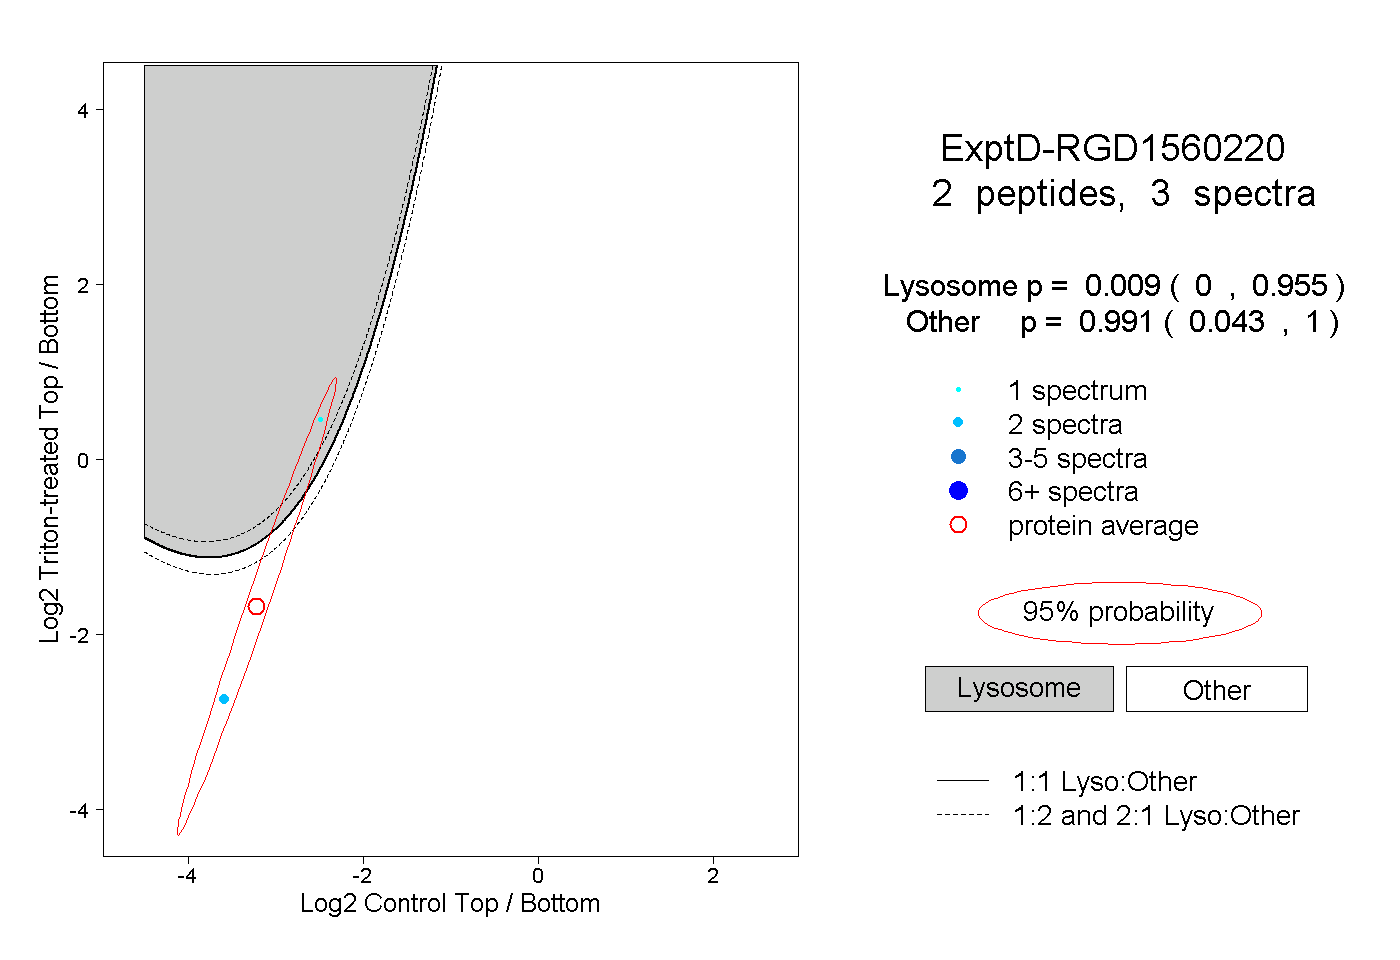 |
0.009 0.000 | 0.955 |
0.991 0.043 | 1.000 |