 4
4peptides
spectra
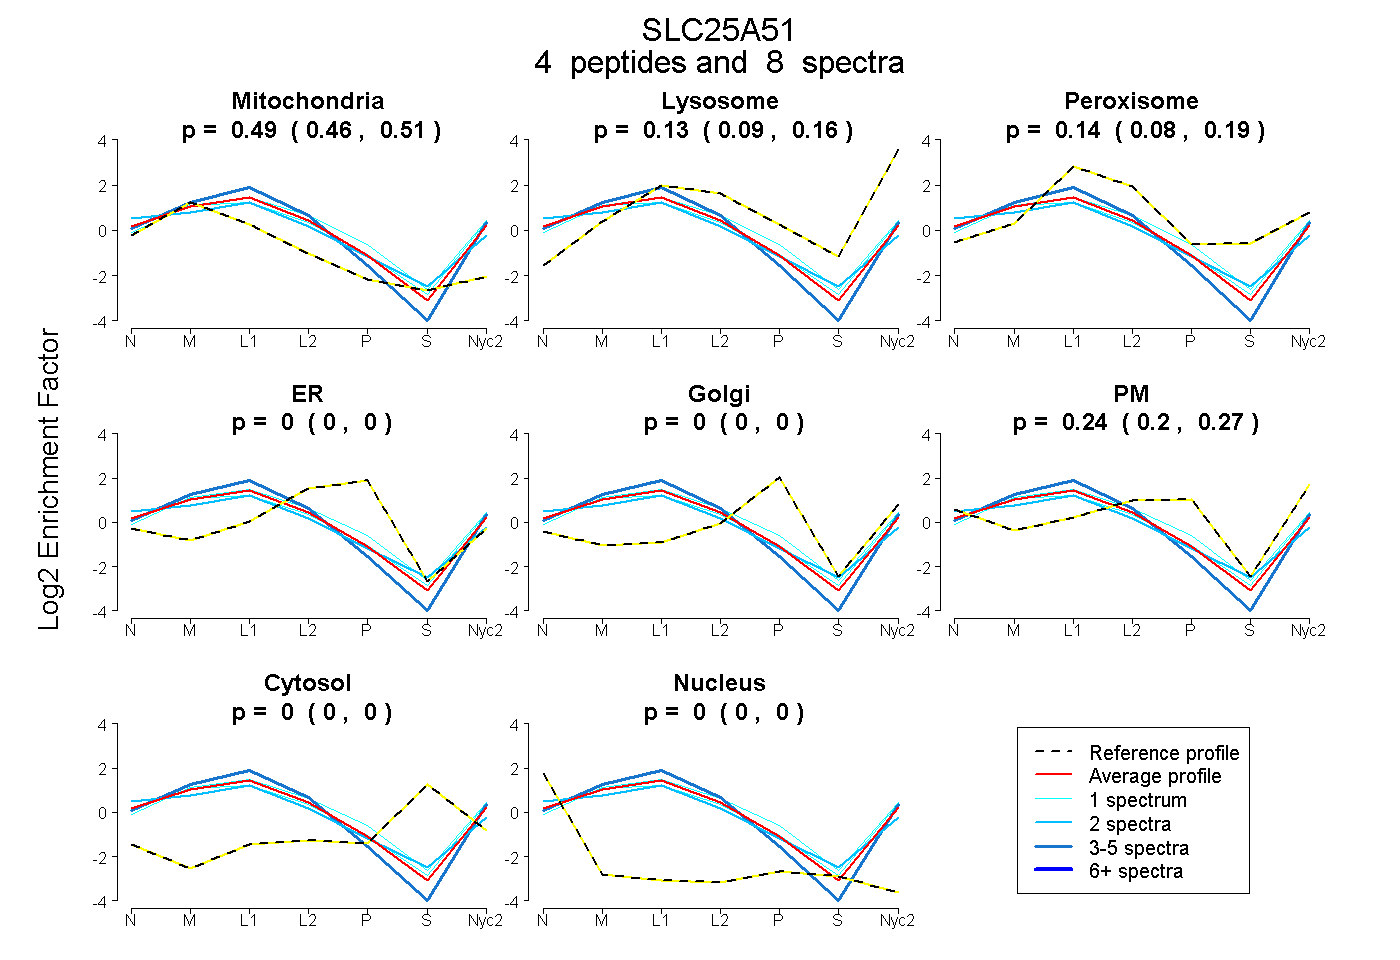
0.464 | 0.512
0.087 | 0.164
0.079 | 0.191
0.000 | 0.000
0.000 | 0.000
0.197 | 0.273
0.000 | 0.000
0.000 | 0.000
1peptide
spectrum
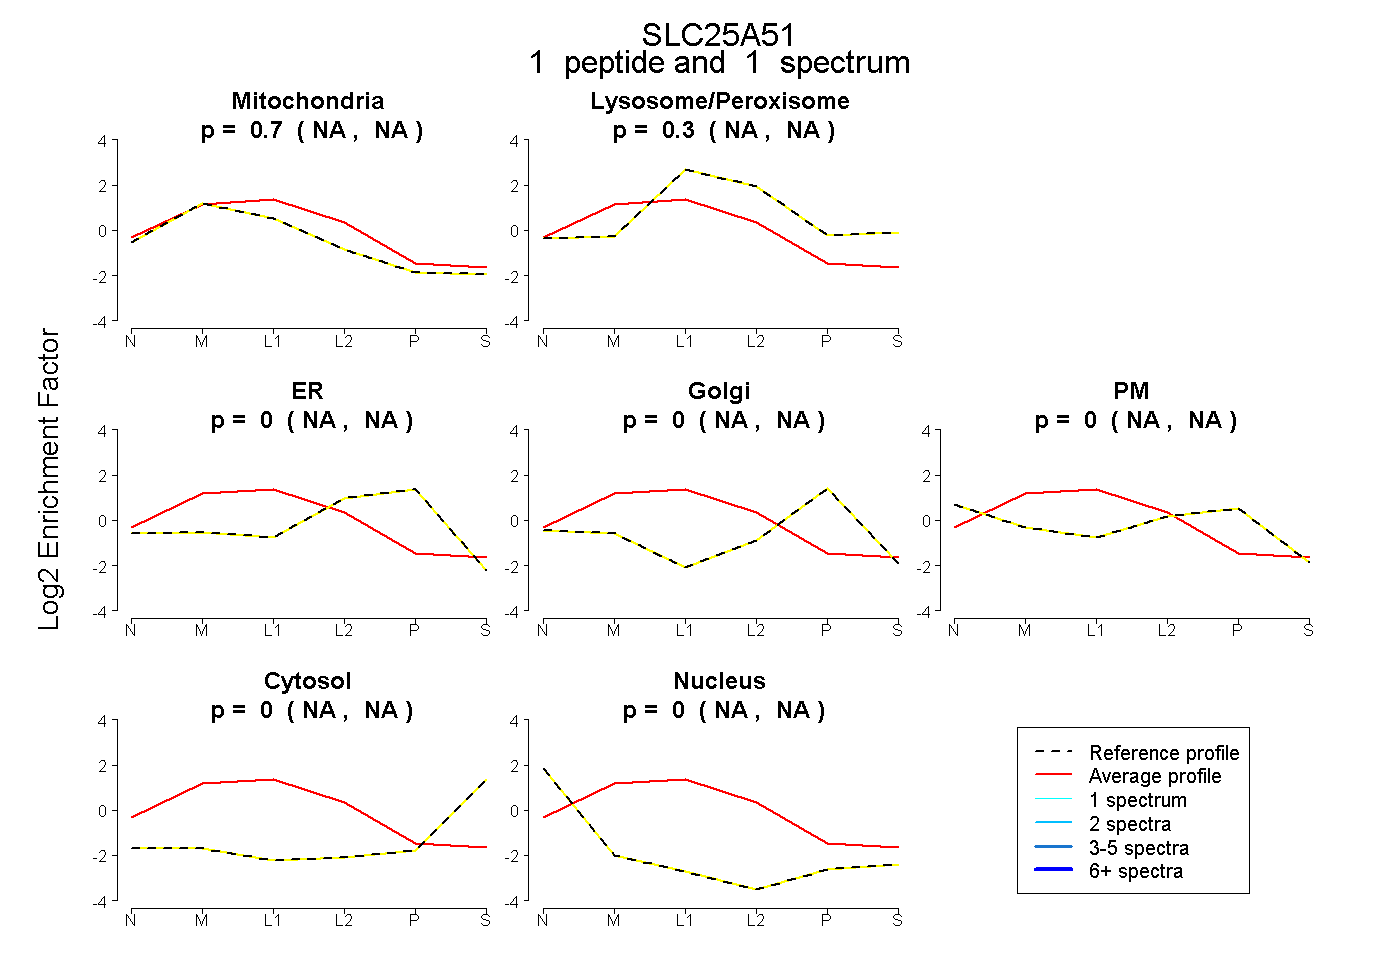
NA | NA
NA | NA
NA | NA
NA | NA
NA | NA
NA | NA
NA | NA
8peptides
spectra
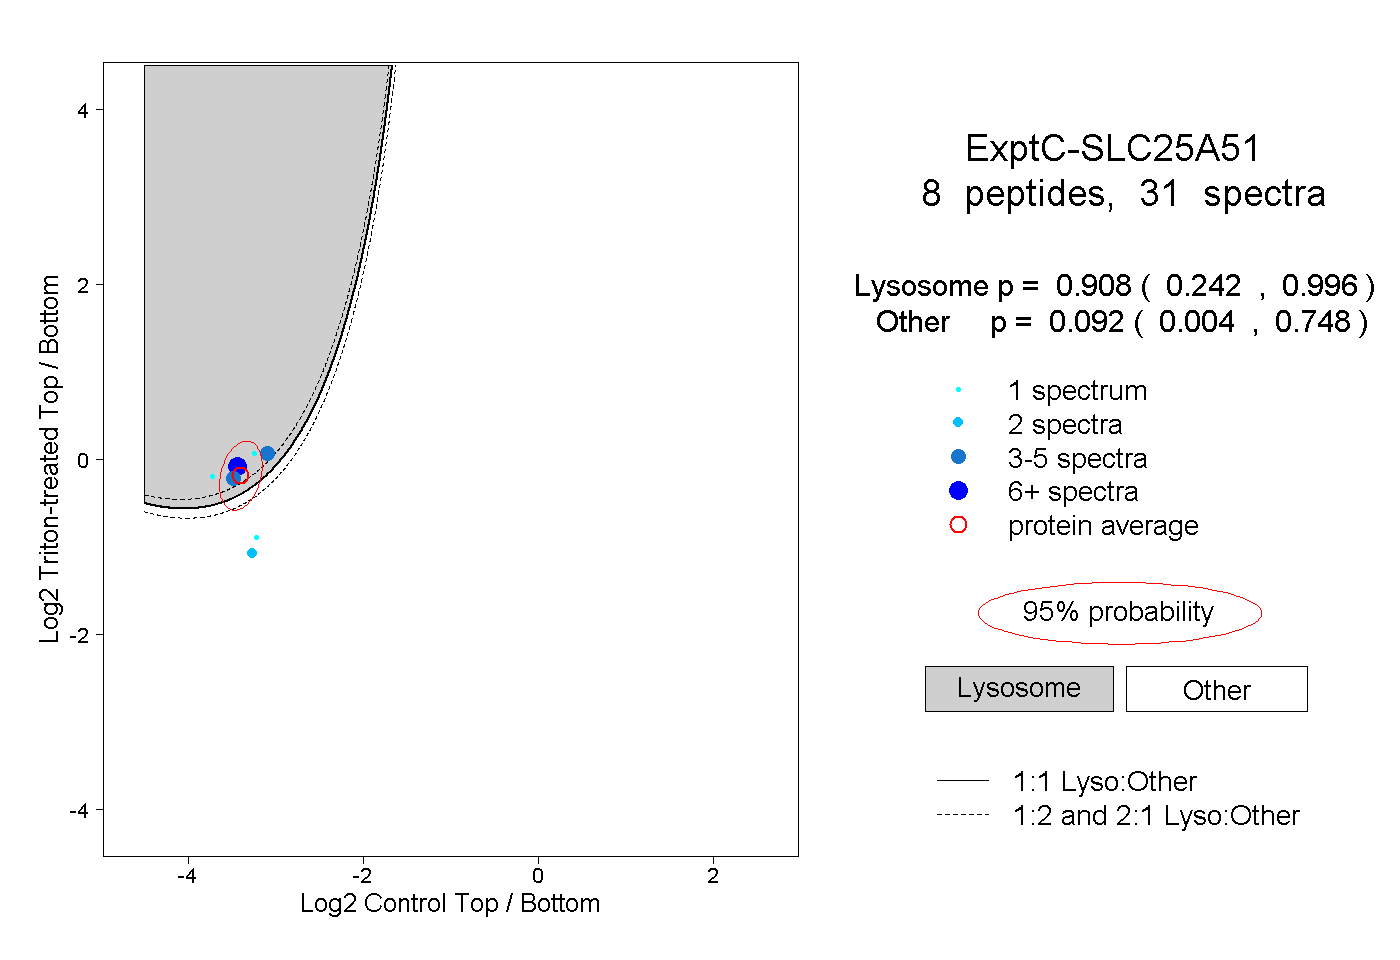
0.242 | 0.996
0.004 | 0.748
2peptides
spectra
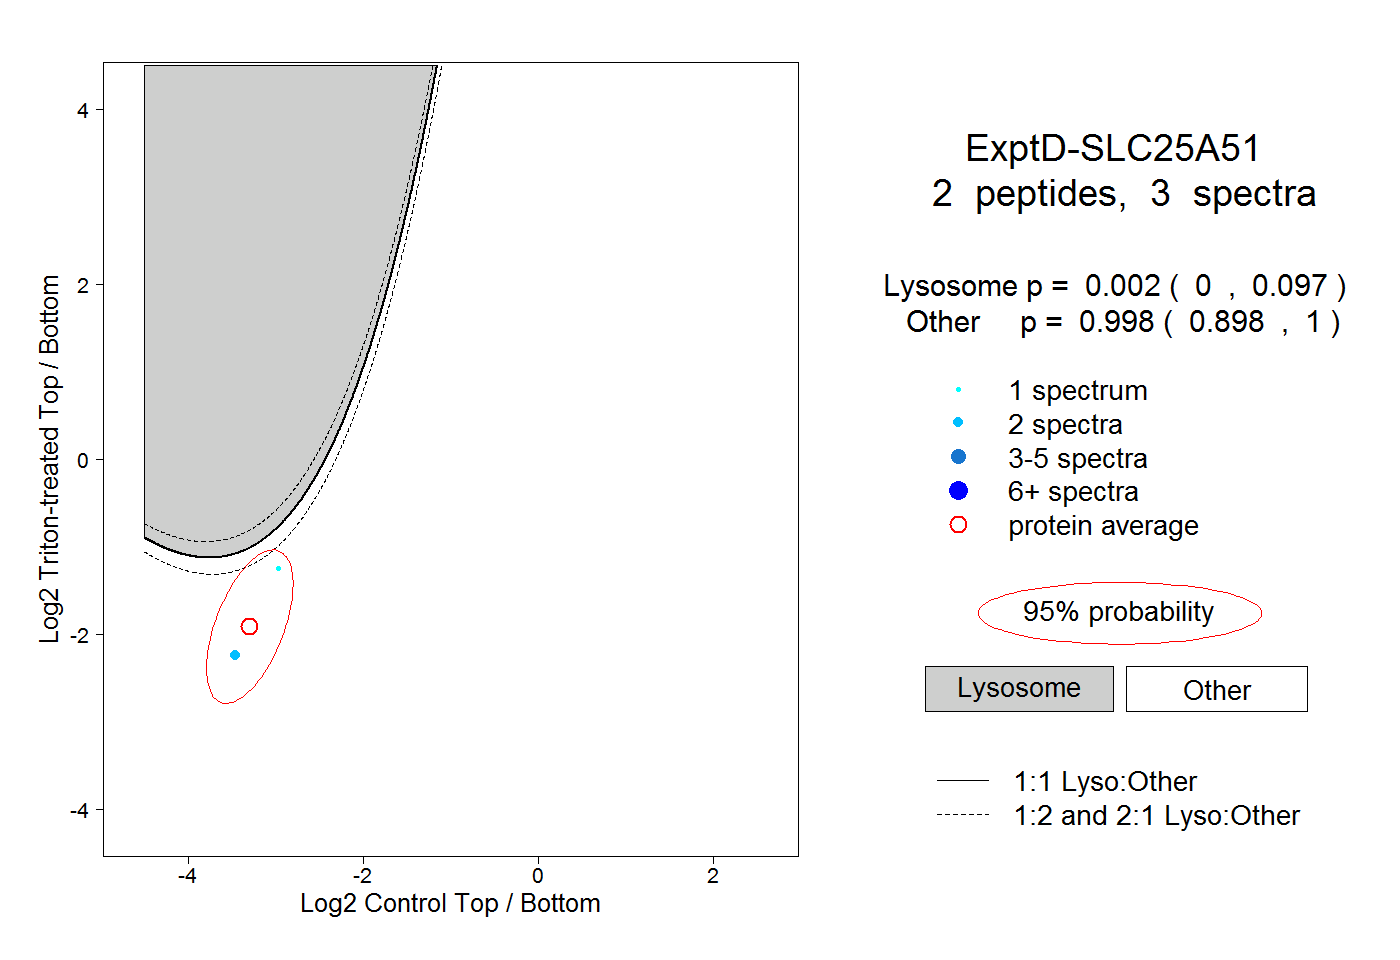
0.000 | 0.097
0.898 | 1.000