 4
4peptides
spectra
0.464 | 0.512
0.087 | 0.164
0.079 | 0.191
0.000 | 0.000
0.000 | 0.000
0.197 | 0.273
0.000 | 0.000
0.000 | 0.000
| Plot | Mito | Lyso | Perox | ER | Golgi | PM | Cytosol | Nucleus | |||||
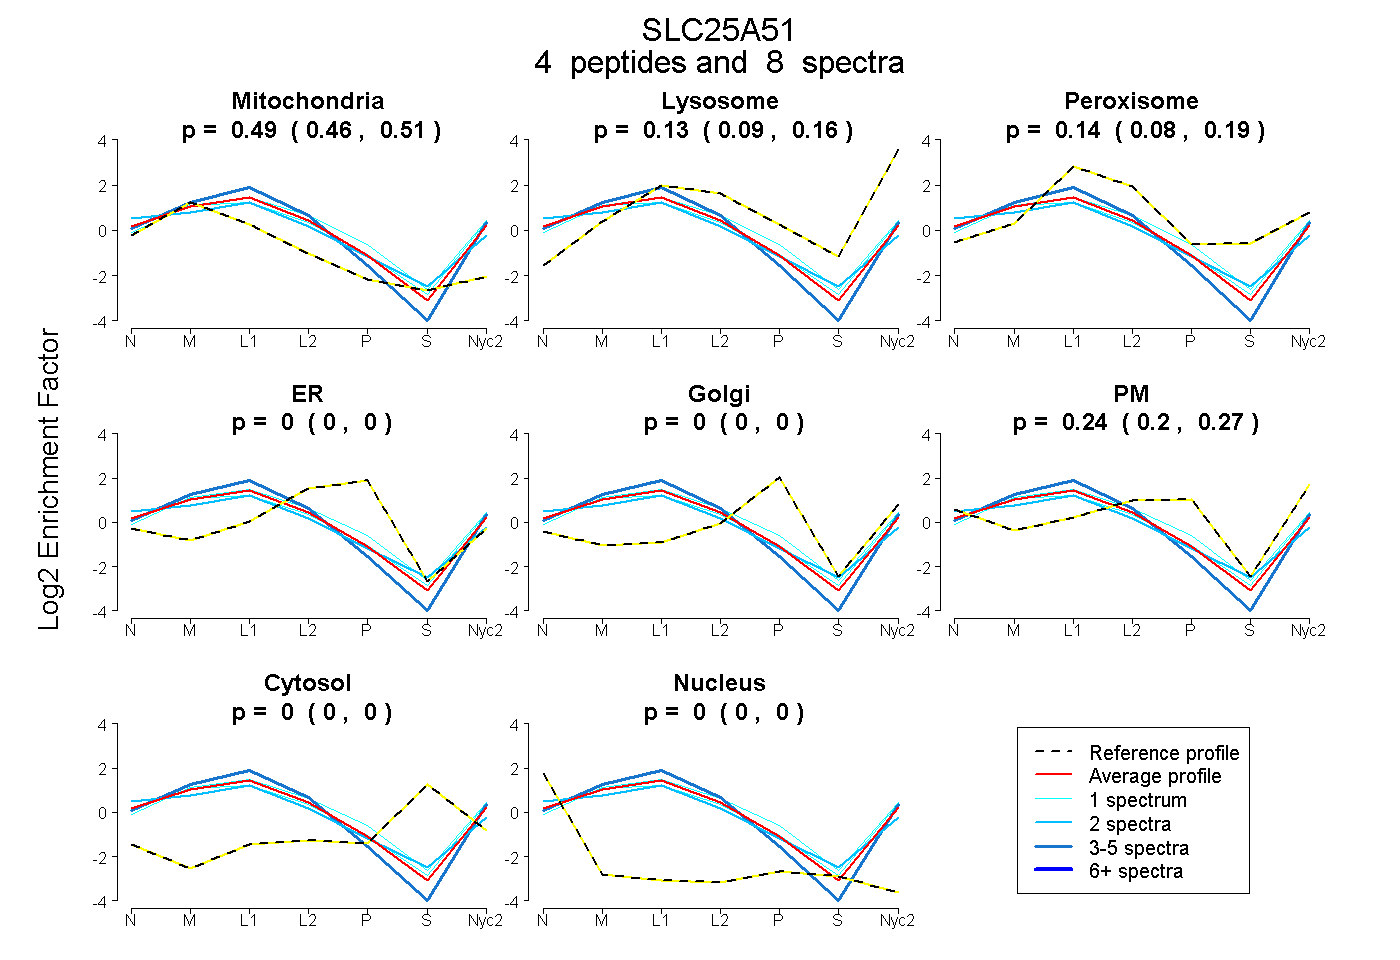
| Expt A |
4 peptides |
8 spectra |
|
0.490 0.464 | 0.512 |
0.128 0.087 | 0.164 |
0.144 0.079 | 0.191 |
0.000 0.000 | 0.000 |
0.000 0.000 | 0.000 |
0.239 0.197 | 0.273 |
0.000 0.000 | 0.000 |
0.000 0.000 | 0.000 |
| 1 spectrum, DAILQLR | 0.405 | 0.189 | 0.174 | 0.000 | 0.000 | 0.232 | 0.000 | 0.000 | ||
| 4 spectra, GLVPILFR | 0.557 | 0.237 | 0.070 | 0.000 | 0.000 | 0.136 | 0.000 | 0.000 | ||
| 1 spectrum, FTNTYQAFR | 0.492 | 0.185 | 0.080 | 0.000 | 0.000 | 0.243 | 0.000 | 0.000 | ||
| 2 spectra, QQLYGIK | 0.505 | 0.000 | 0.226 | 0.000 | 0.000 | 0.268 | 0.000 | 0.000 |
| Plot | Mito | Lyso or Perox | ER | Golgi | PM | Cytosol | Nucleus | ||||||
| Expt B |
1 peptide |
1 spectrum |
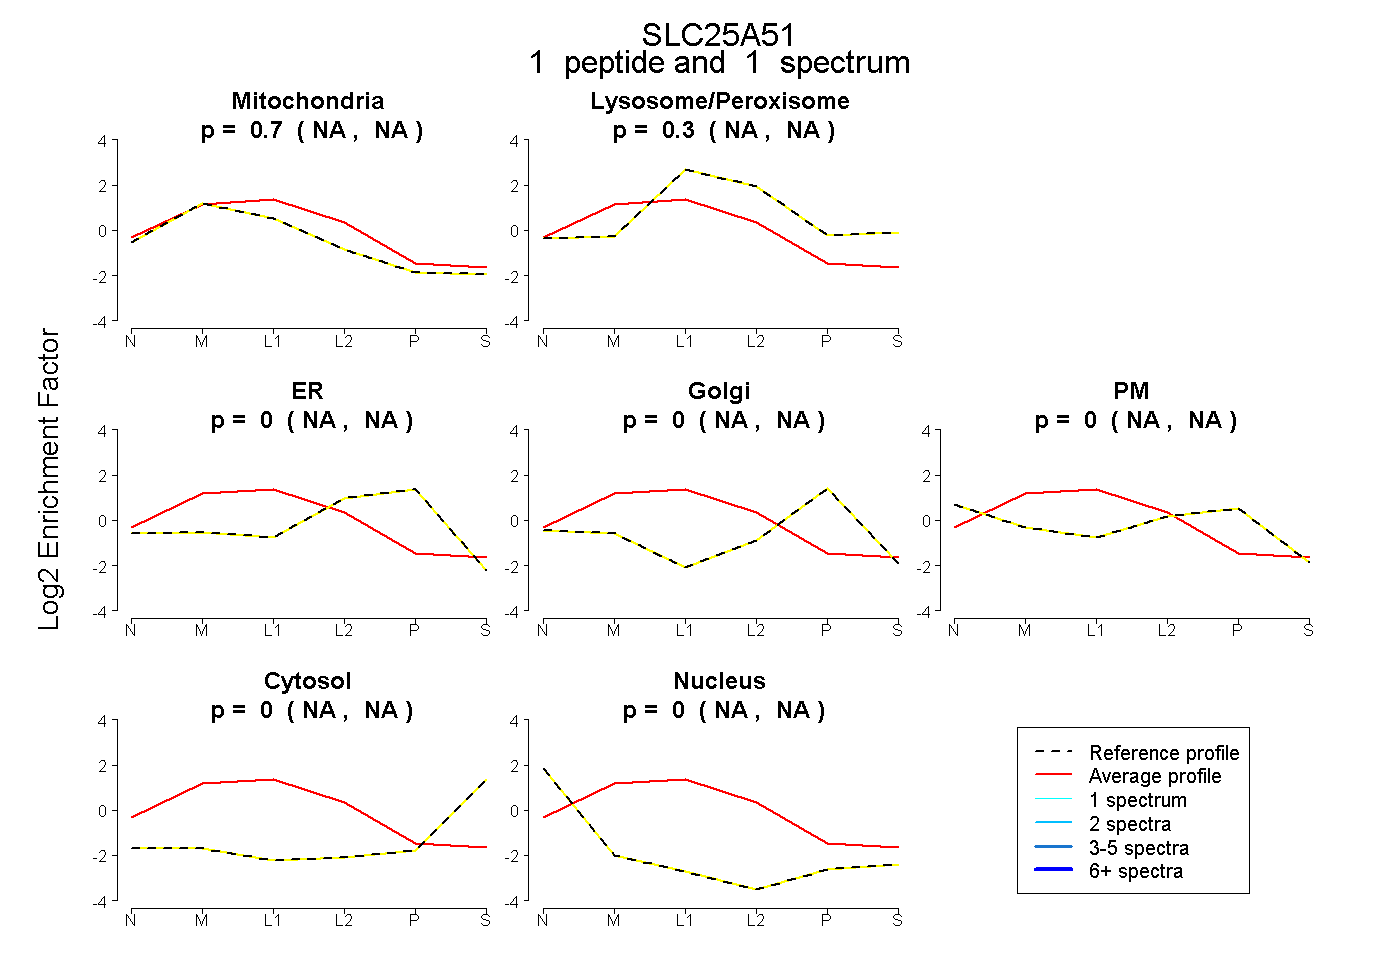 |
0.697 NA | NA |
0.303 NA | NA |
0.000 NA | NA |
0.000 NA | NA |
0.000 NA | NA |
0.000 NA | NA |
0.000 NA | NA |
|||
| Plot | Lyso | Other | |||||||||||
| Expt C |
8 peptides |
31 spectra |
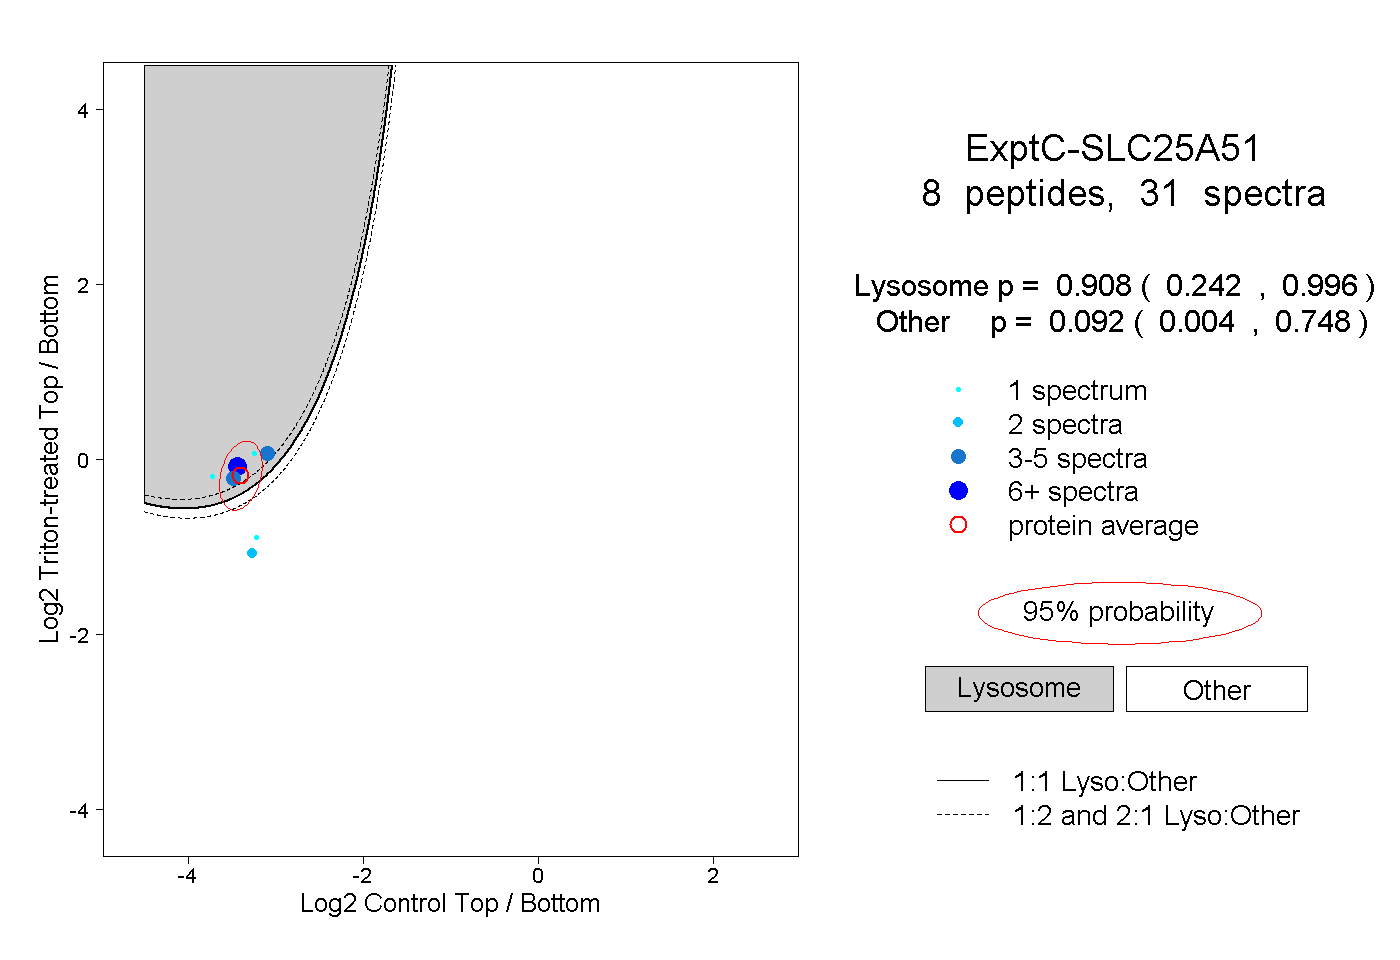 |
0.908 0.242 | 0.996 |
0.092 0.004 | 0.748 |
||||||||
| Plot | Lyso | Other | |||||||||||
| Expt D |
2 peptides |
3 spectra |
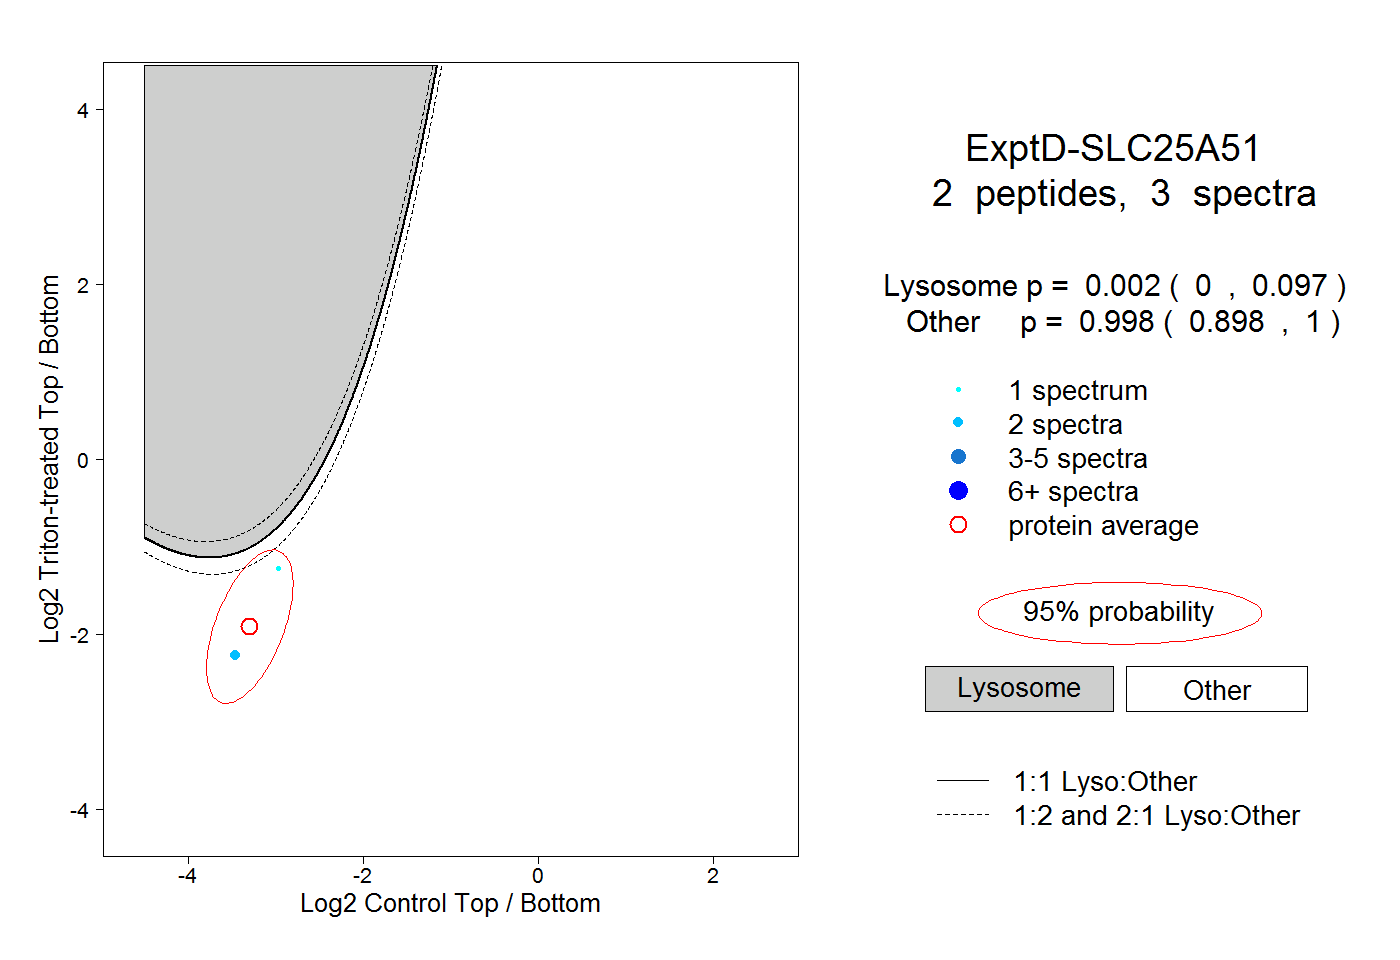 |
0.002 0.000 | 0.097 |
0.998 0.898 | 1.000 |