 11
11peptides
spectra
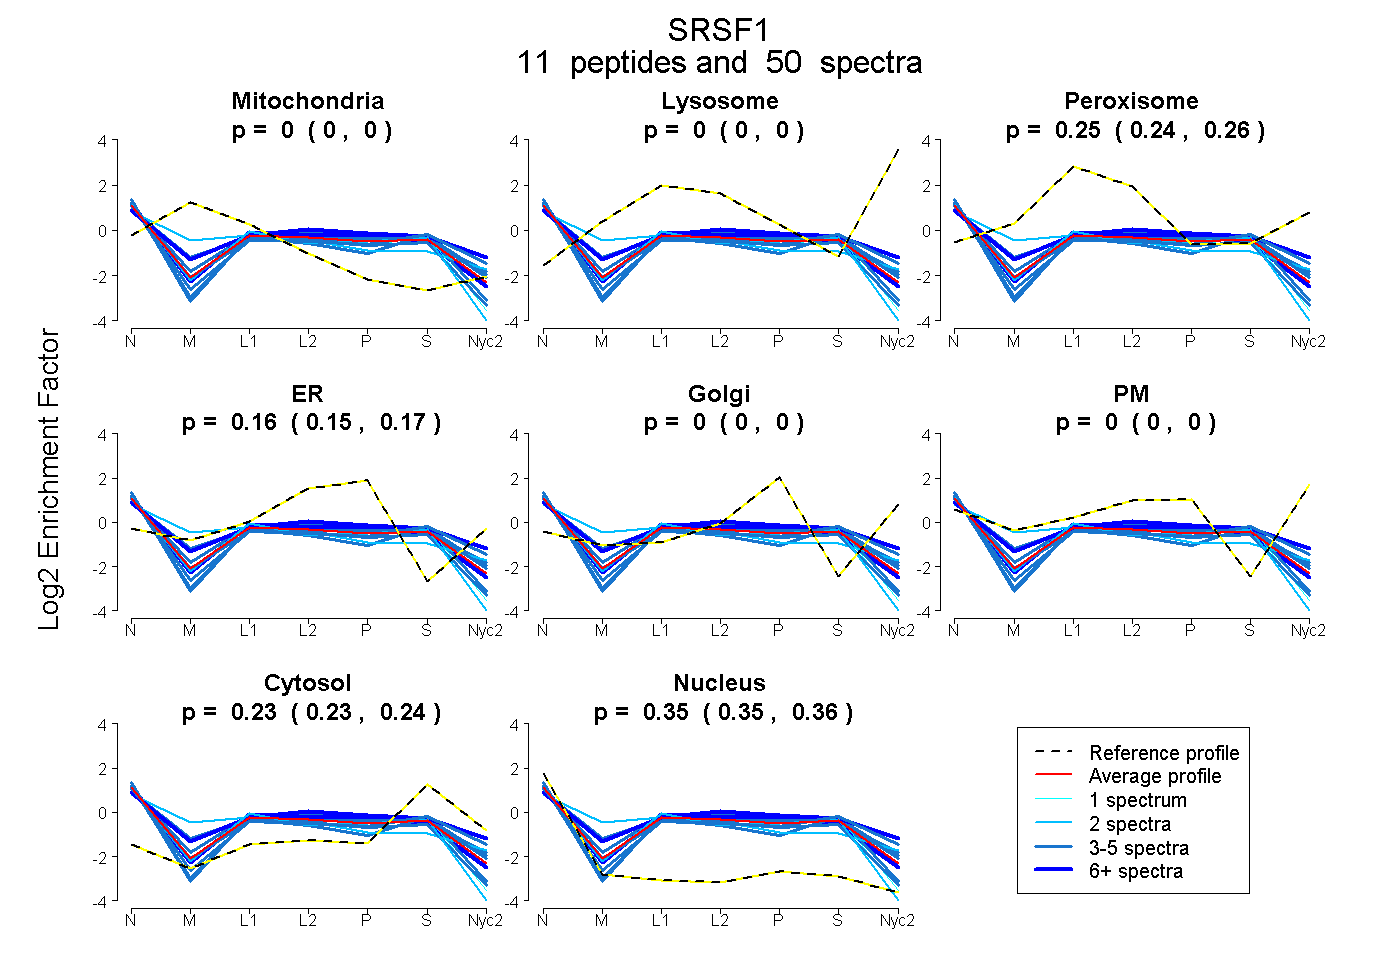
0.000 | 0.000
0.000 | 0.000
0.244 | 0.258
0.153 | 0.165
0.000 | 0.000
0.000 | 0.000
0.227 | 0.240
0.349 | 0.360
6peptides
spectra
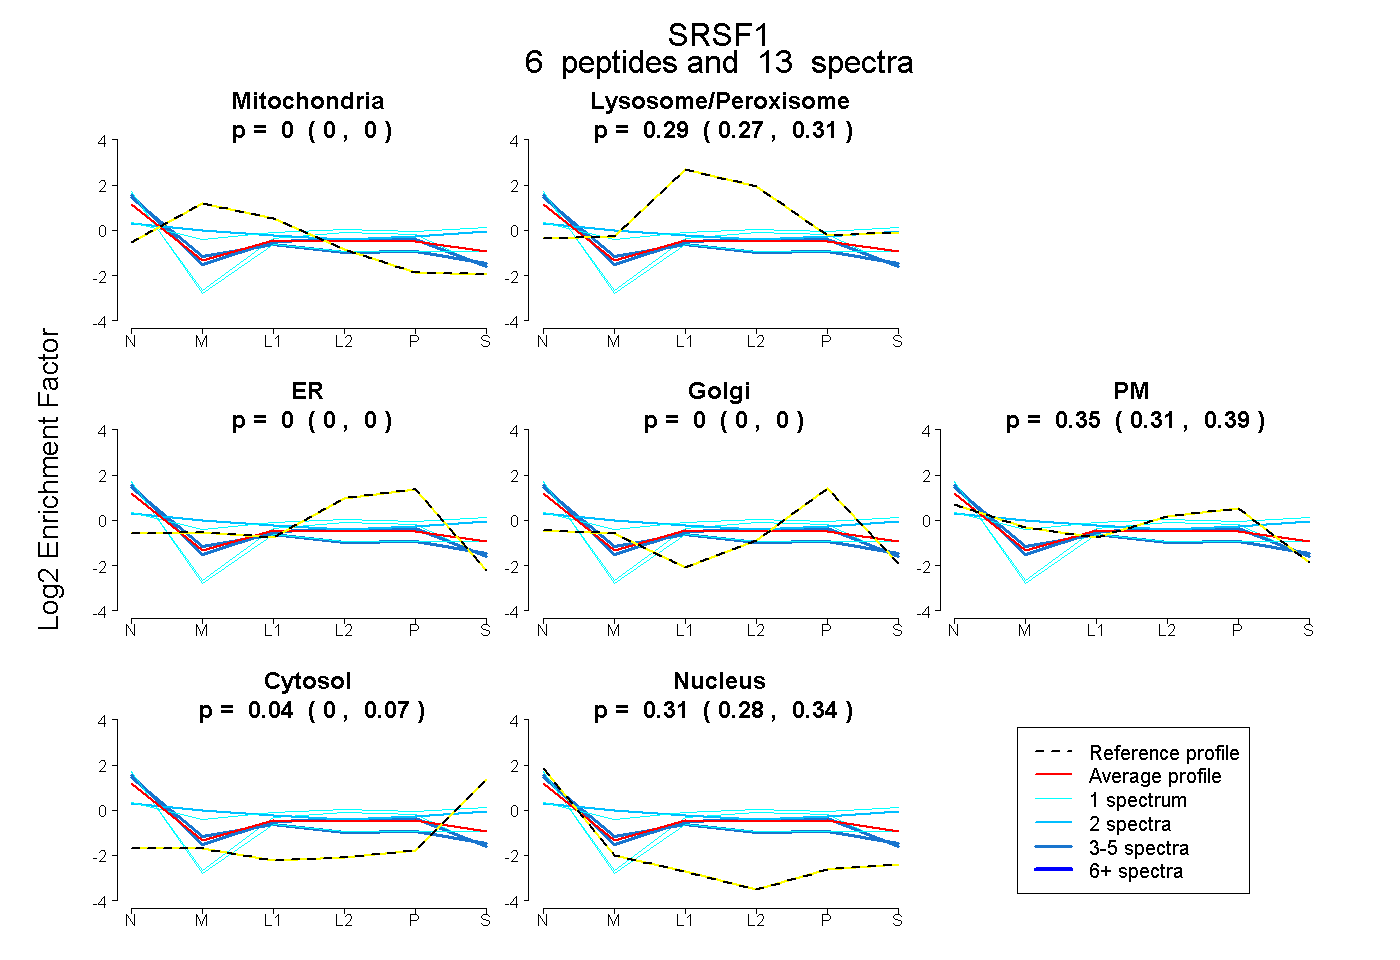
0.000 | 0.000
0.275 | 0.309
0.000 | 0.000
0.000 | 0.000
0.308 | 0.387
0.005 | 0.069
0.282 | 0.340
9peptides
spectra
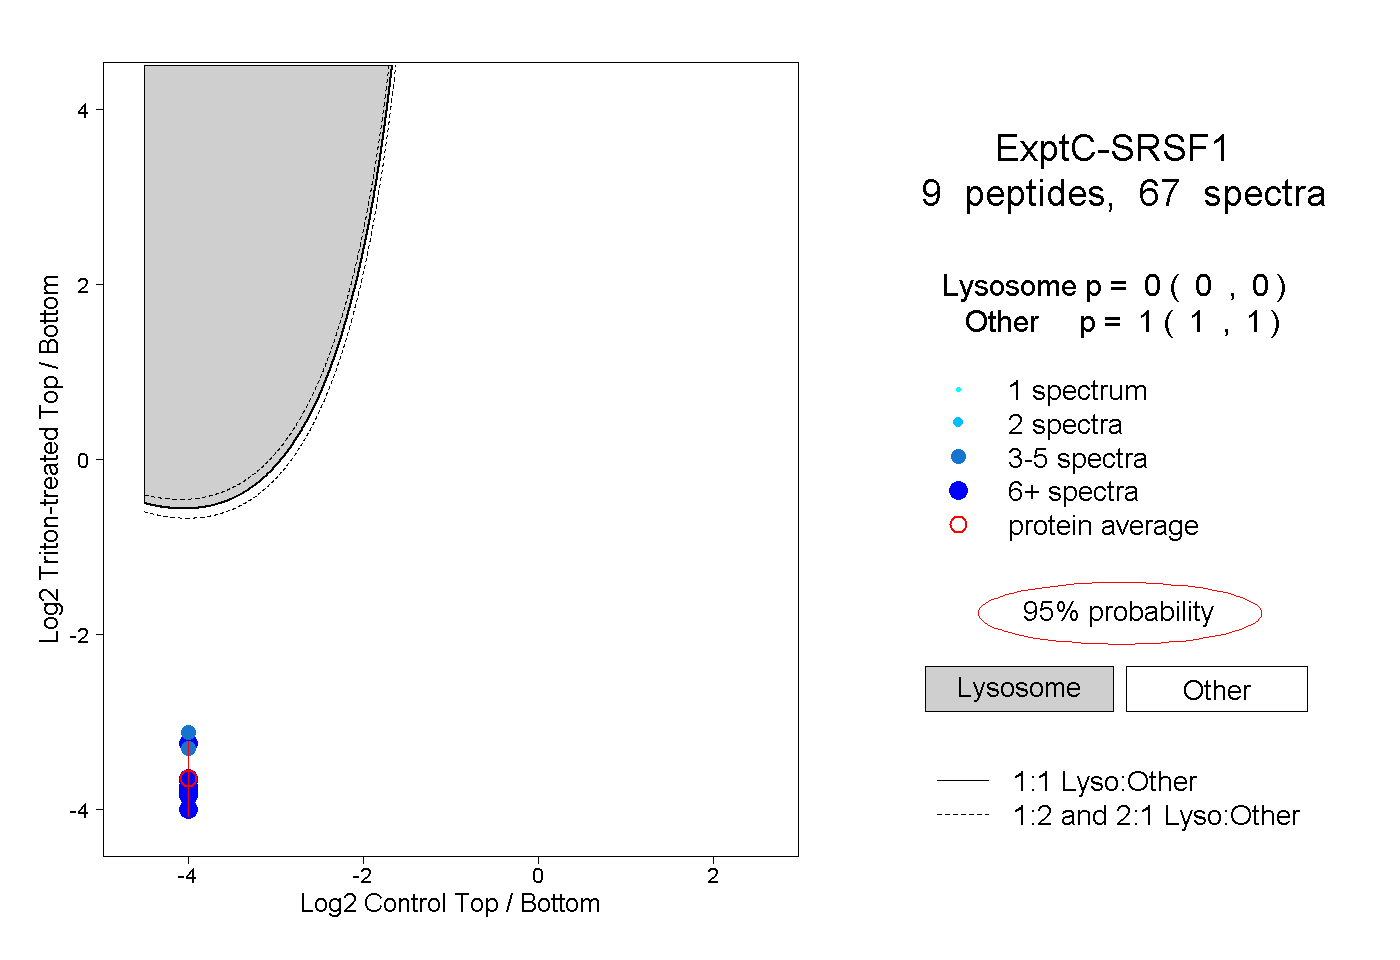
0.000 | 0.000
1.000 | 1.000
3peptides
spectra
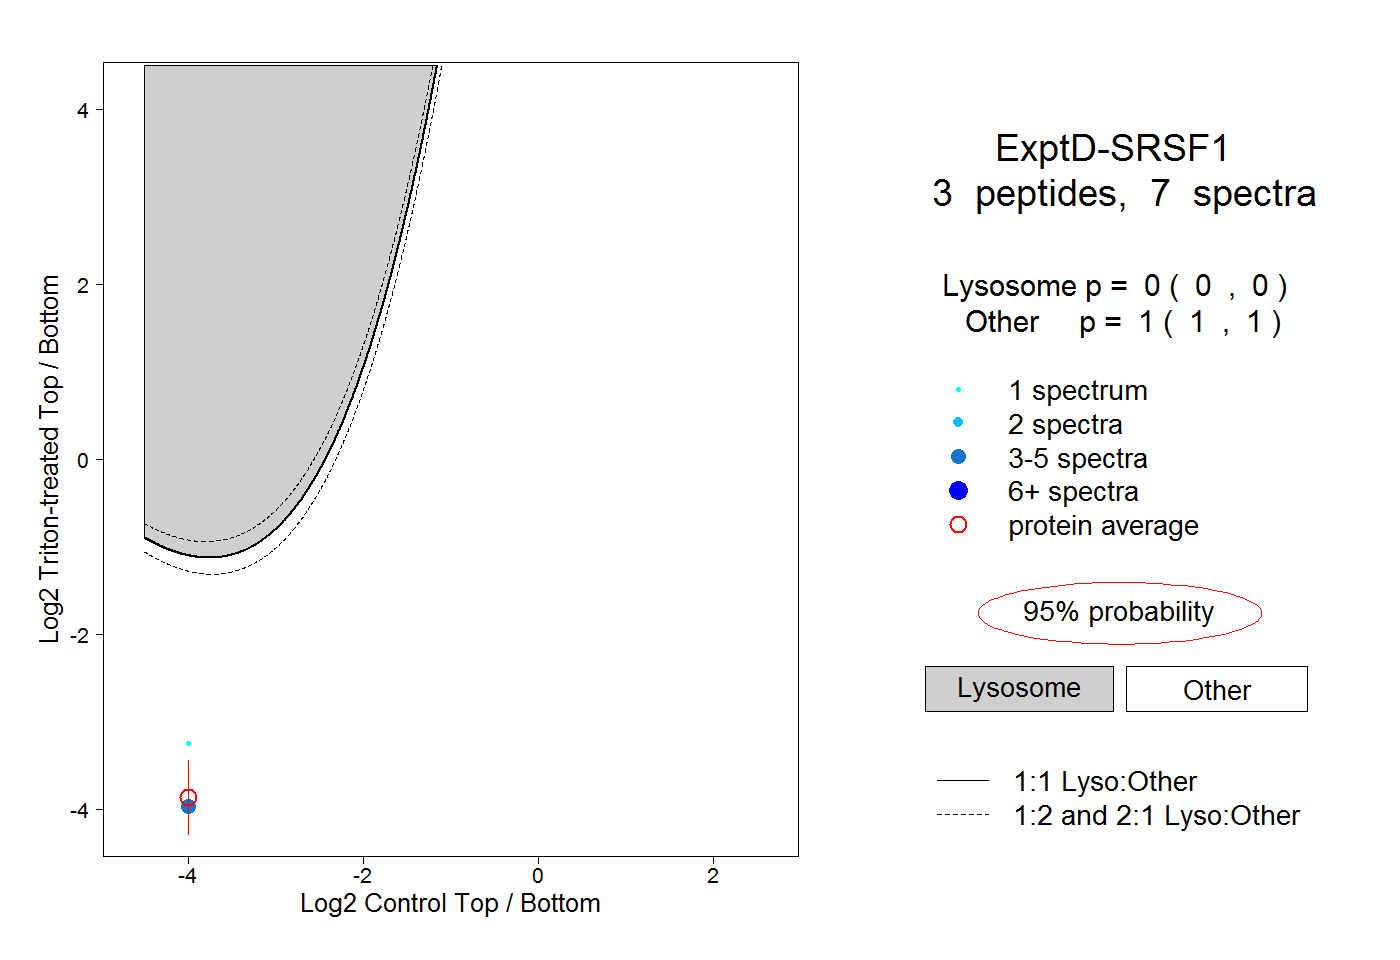
0.000 | 0.000
1.000 | 1.000