SRSF1
[ENSRNOP00000064933]
Main page
| | | Plot |
Mito |
Lyso |
|
Perox |
ER |
Golgi |
PM |
Cytosol |
Nucleus |
|
| Expt A |
 11
11
peptides |
50
spectra |
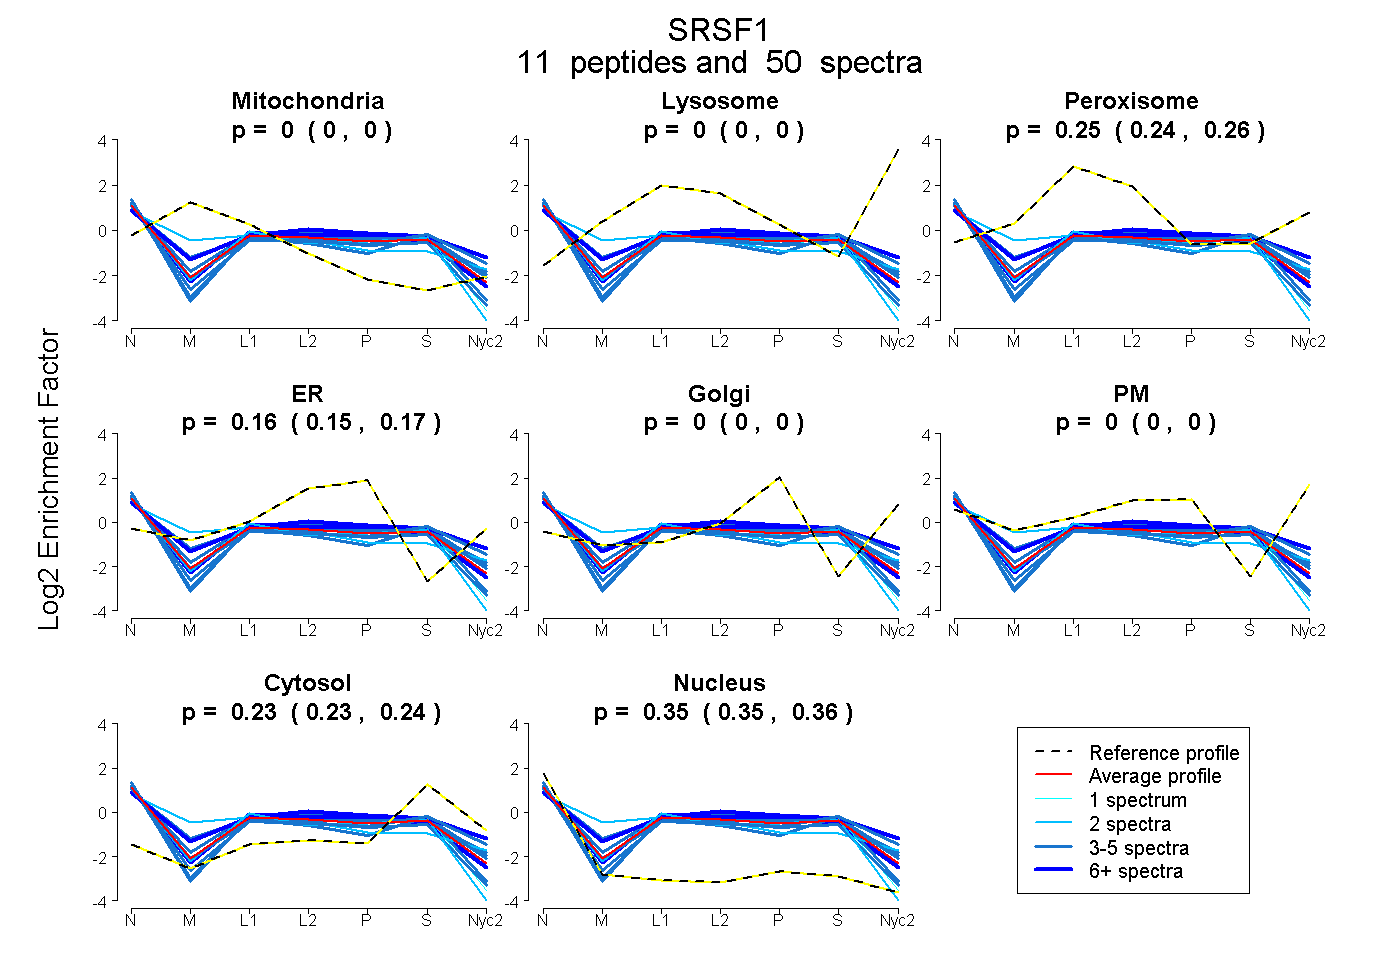 |
0.000
0.000 | 0.000 |
0.000
0.000 | 0.000 |
|
0.251
0.244 | 0.258 |
0.160
0.153 | 0.165 |
0.000
0.000 | 0.000 |
0.000
0.000 | 0.000 |
0.234
0.227 | 0.240 |
0.355
0.349 | 0.360 |
|
| | | Plot |
Mito |
|
Lyso or Perox |
|
ER |
Golgi |
PM |
Cytosol |
Nucleus |
|
| Expt B |
6
peptides |
13
spectra |
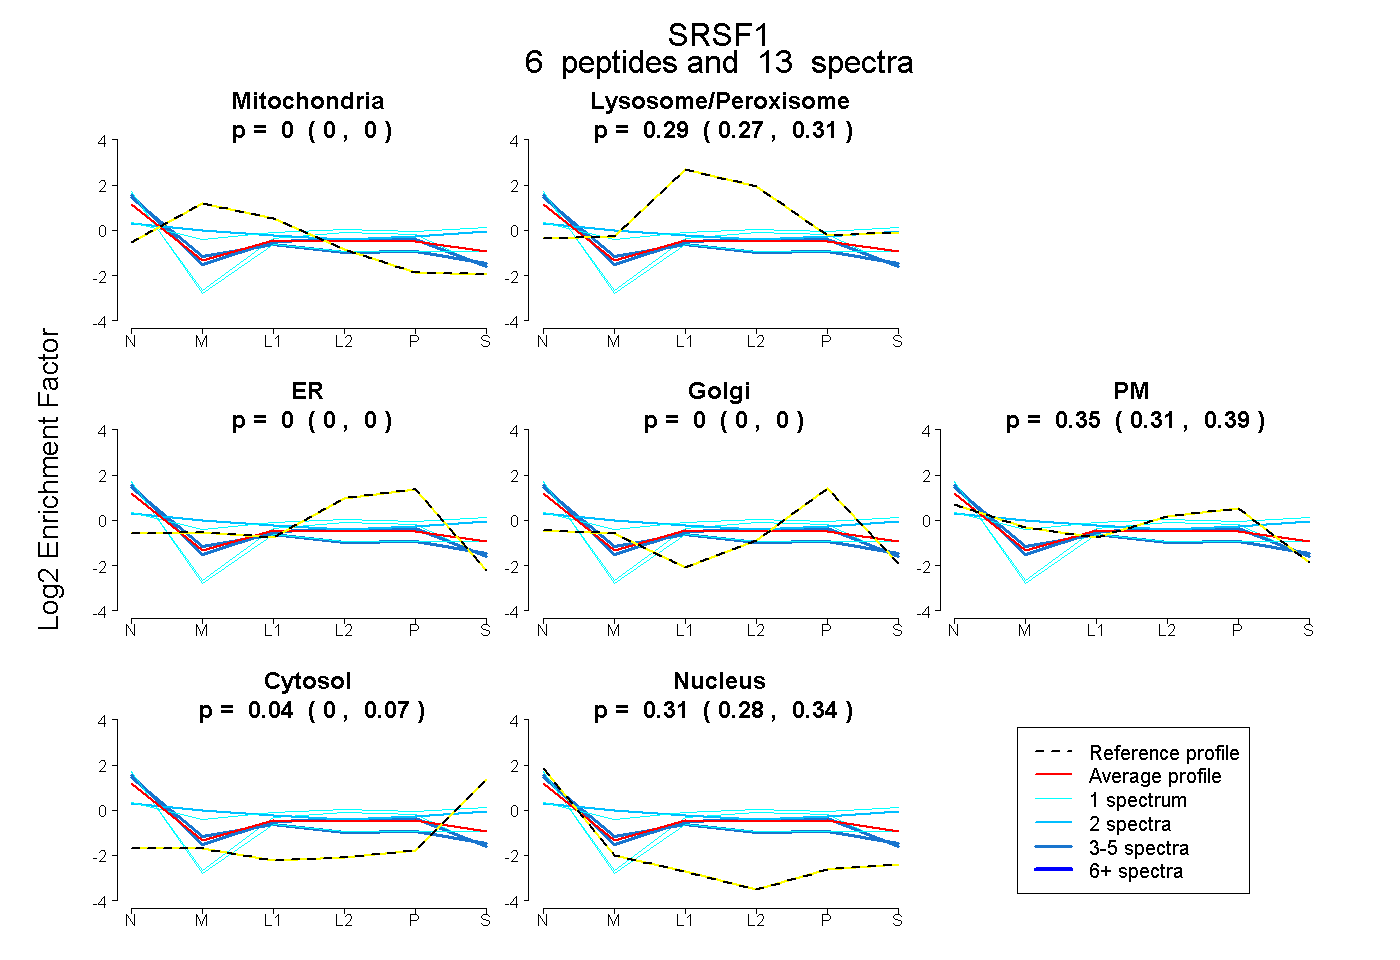 |
0.000
0.000 | 0.000 |
|
0.294
0.275 | 0.309 |
|
0.000
0.000 | 0.000 |
0.000
0.000 | 0.000 |
0.352
0.308 | 0.387 |
0.041
0.005 | 0.069 |
0.313
0.282 | 0.340 |
|
| 1 spectrum, DIEDVFYK |
0.000 |
|
0.389 |
|
0.011 |
0.000 |
0.017 |
0.000 |
0.582 |
|
| 3 spectra, DGTGVVEFVR |
0.000 |
|
0.269 |
|
0.000 |
0.000 |
0.282 |
0.000 |
0.449 |
|
| 1 spectrum, DAEDAVYGR |
0.000 |
|
0.281 |
|
0.134 |
0.000 |
0.209 |
0.000 |
0.377 |
|
| 5 spectra, DGYDYDGYR |
0.000 |
|
0.222 |
|
0.000 |
0.000 |
0.458 |
0.000 |
0.320 |
|
| 1 spectrum, SHEGETAYIR |
0.000 |
|
0.309 |
|
0.000 |
0.000 |
0.437 |
0.255 |
0.000 |
|
| 2 spectra, IYVGNLPPDIR |
0.084 |
|
0.216 |
|
0.000 |
0.000 |
0.439 |
0.261 |
0.000 |
|
| | | Plot |
|
Lyso |
|
|
|
|
|
|
|
Other |
| Expt C |
9
peptides |
67
spectra |
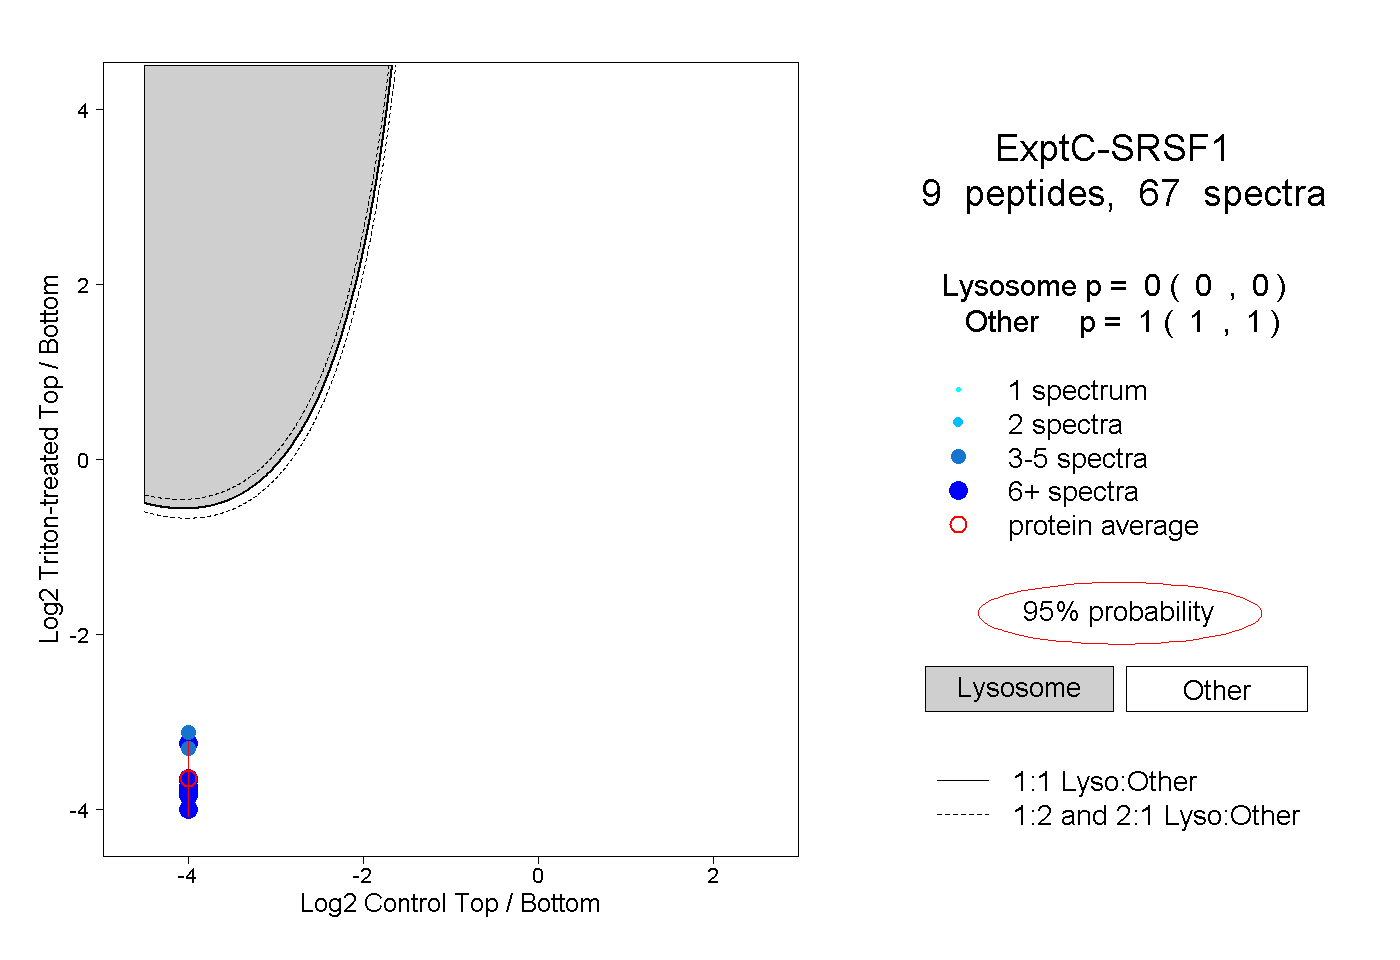 |
|
0.000
0.000 | 0.000 |
|
|
|
|
|
|
|
1.000
1.000 | 1.000 |
| | | Plot |
|
Lyso |
|
|
|
|
|
|
|
Other |
| Expt D |
3
peptides |
7
spectra |
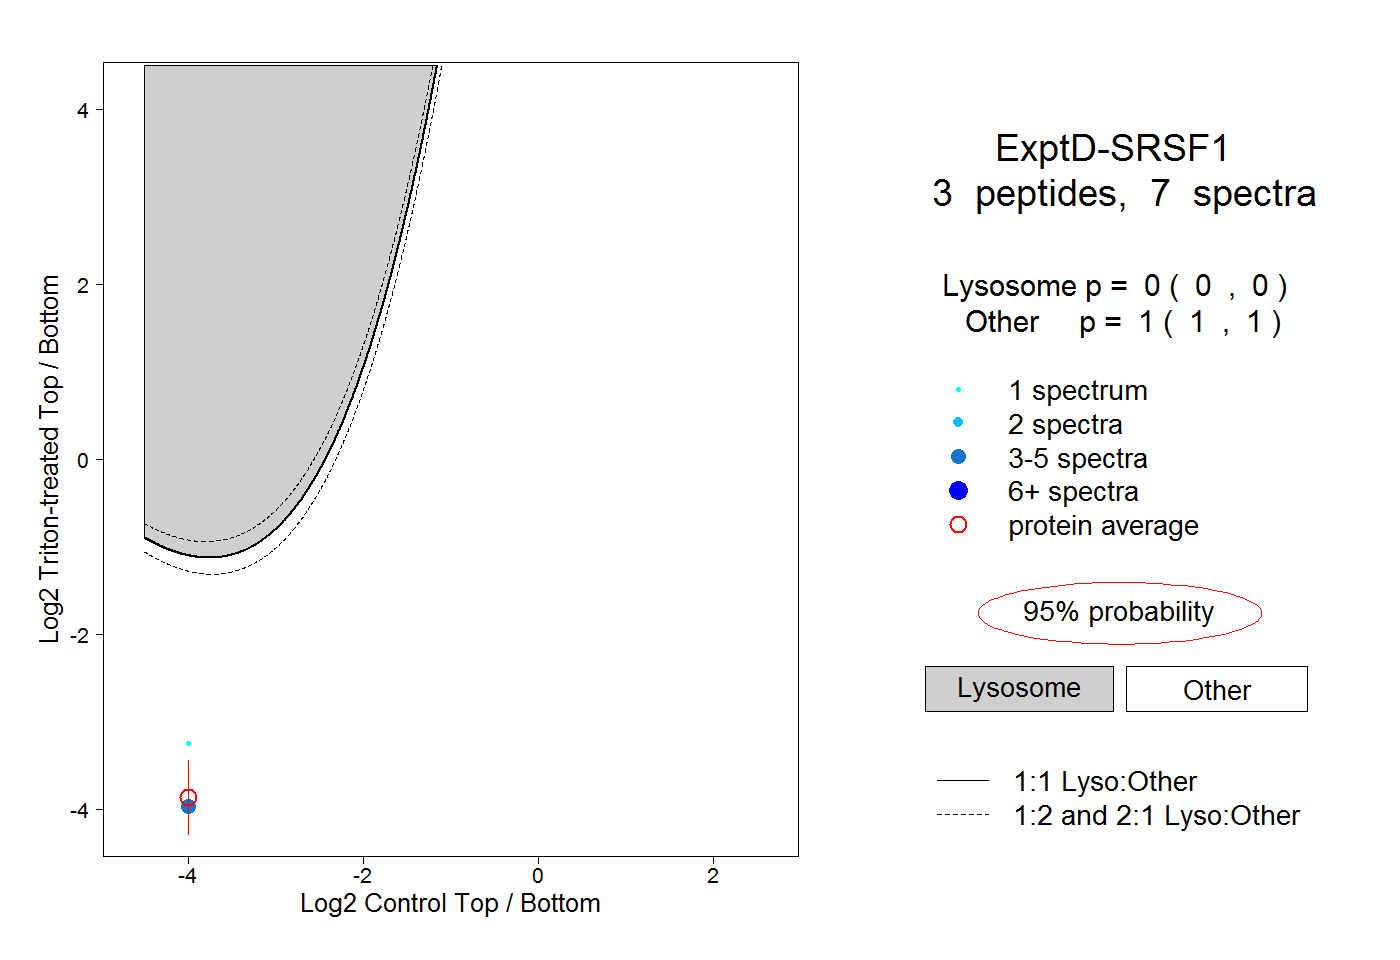 |
|
0.000
0.000 | 0.000 |
|
|
|
|
|
|
|
1.000
1.000 | 1.000 |