 7
7peptides
spectra
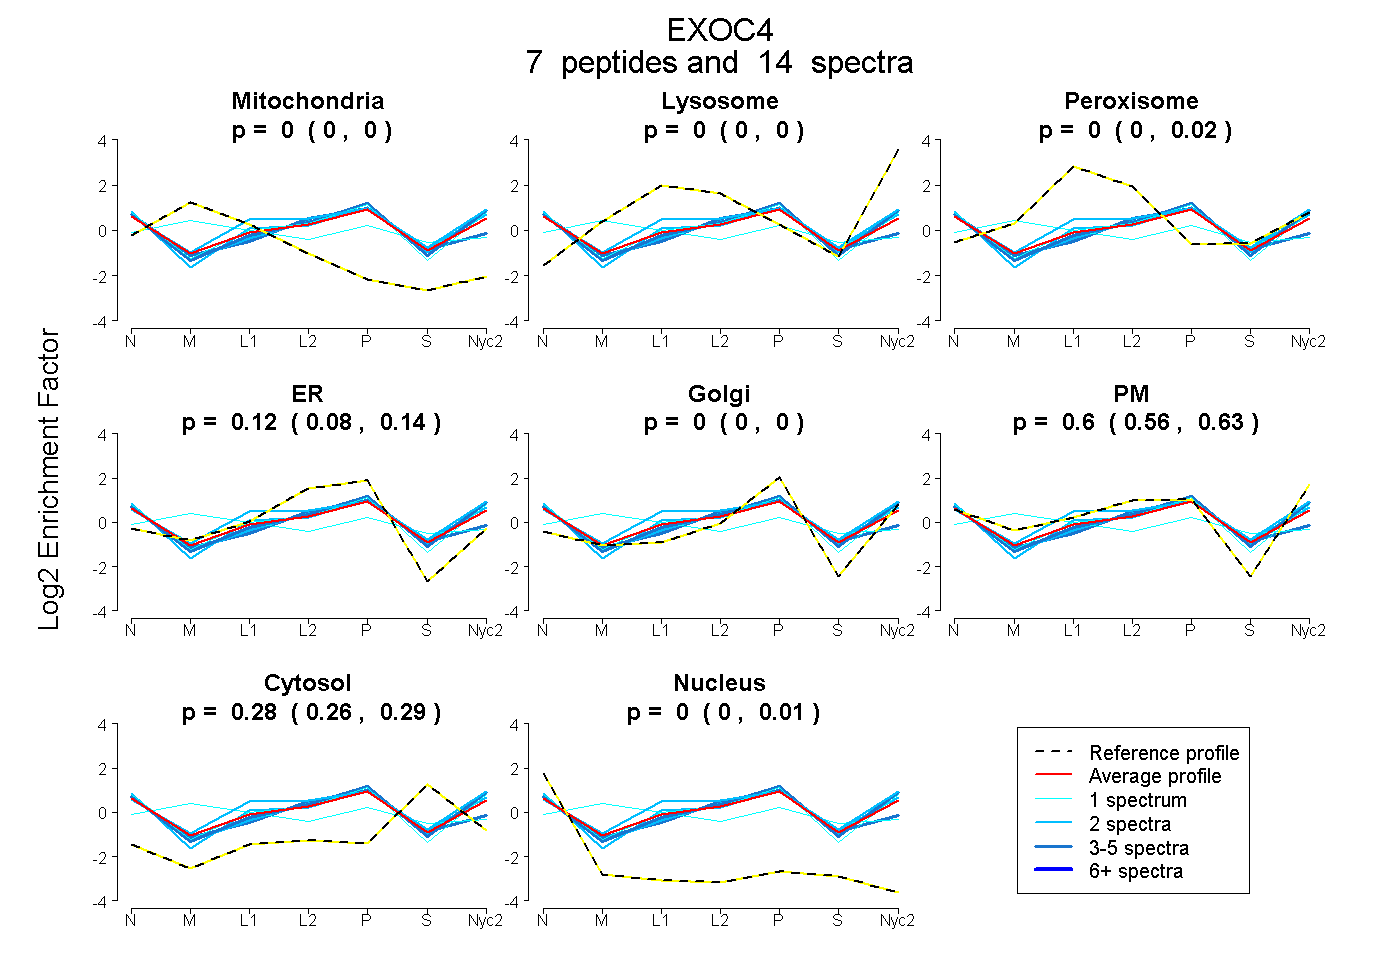
0.000 | 0.000
0.000 | 0.000
0.000 | 0.021
0.082 | 0.145
0.000 | 0.000
0.555 | 0.631
0.262 | 0.286
0.000 | 0.013
2peptides
spectra
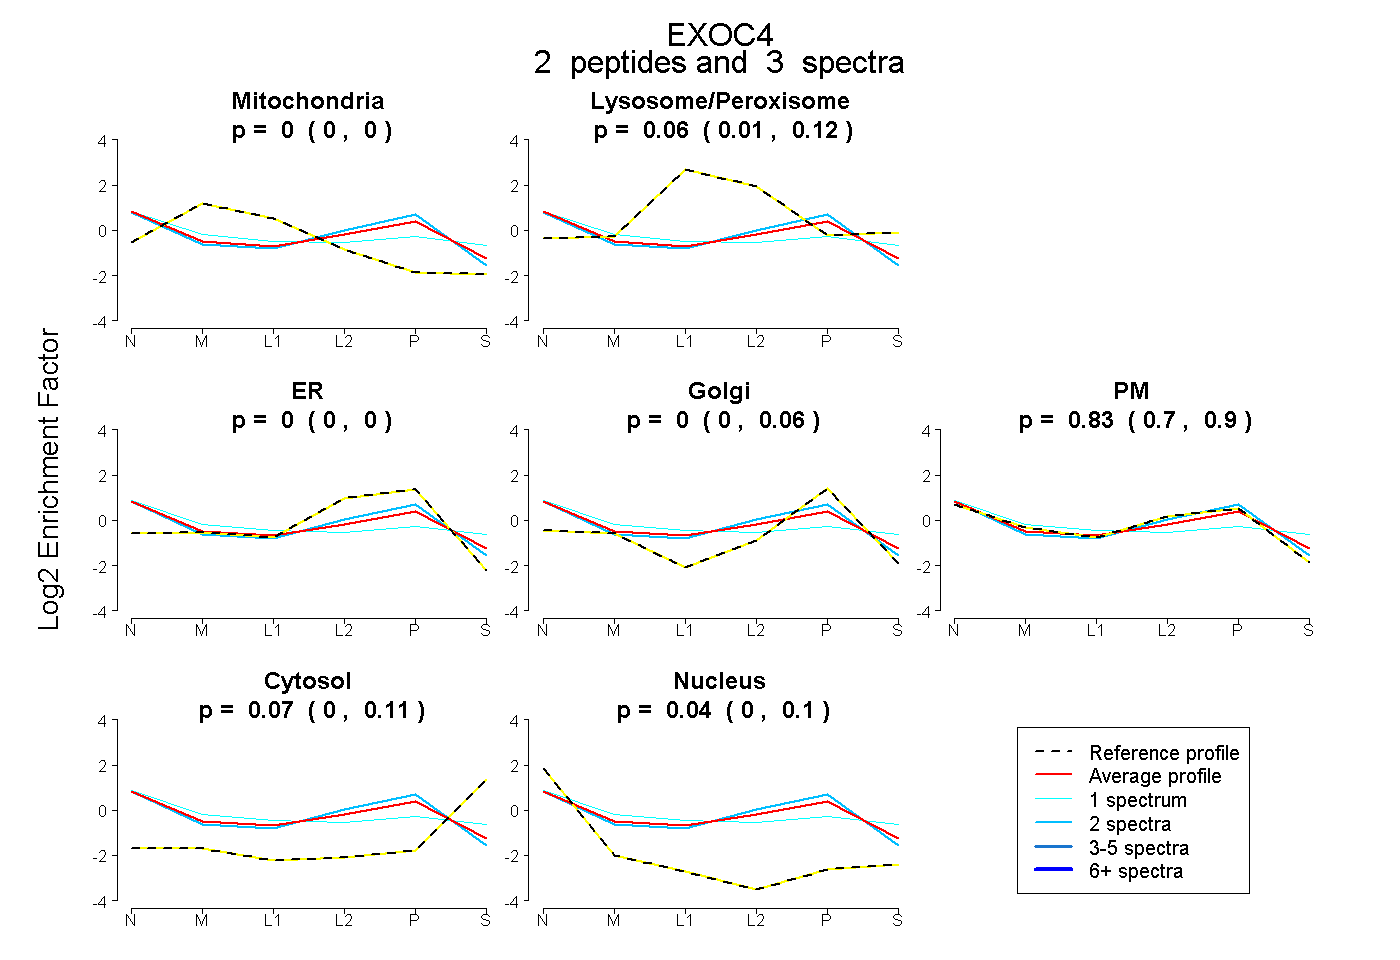
0.000 | 0.000
0.011 | 0.119
0.000 | 0.000
0.000 | 0.058
0.699 | 0.903
0.004 | 0.111
0.000 | 0.103
10peptides
spectra
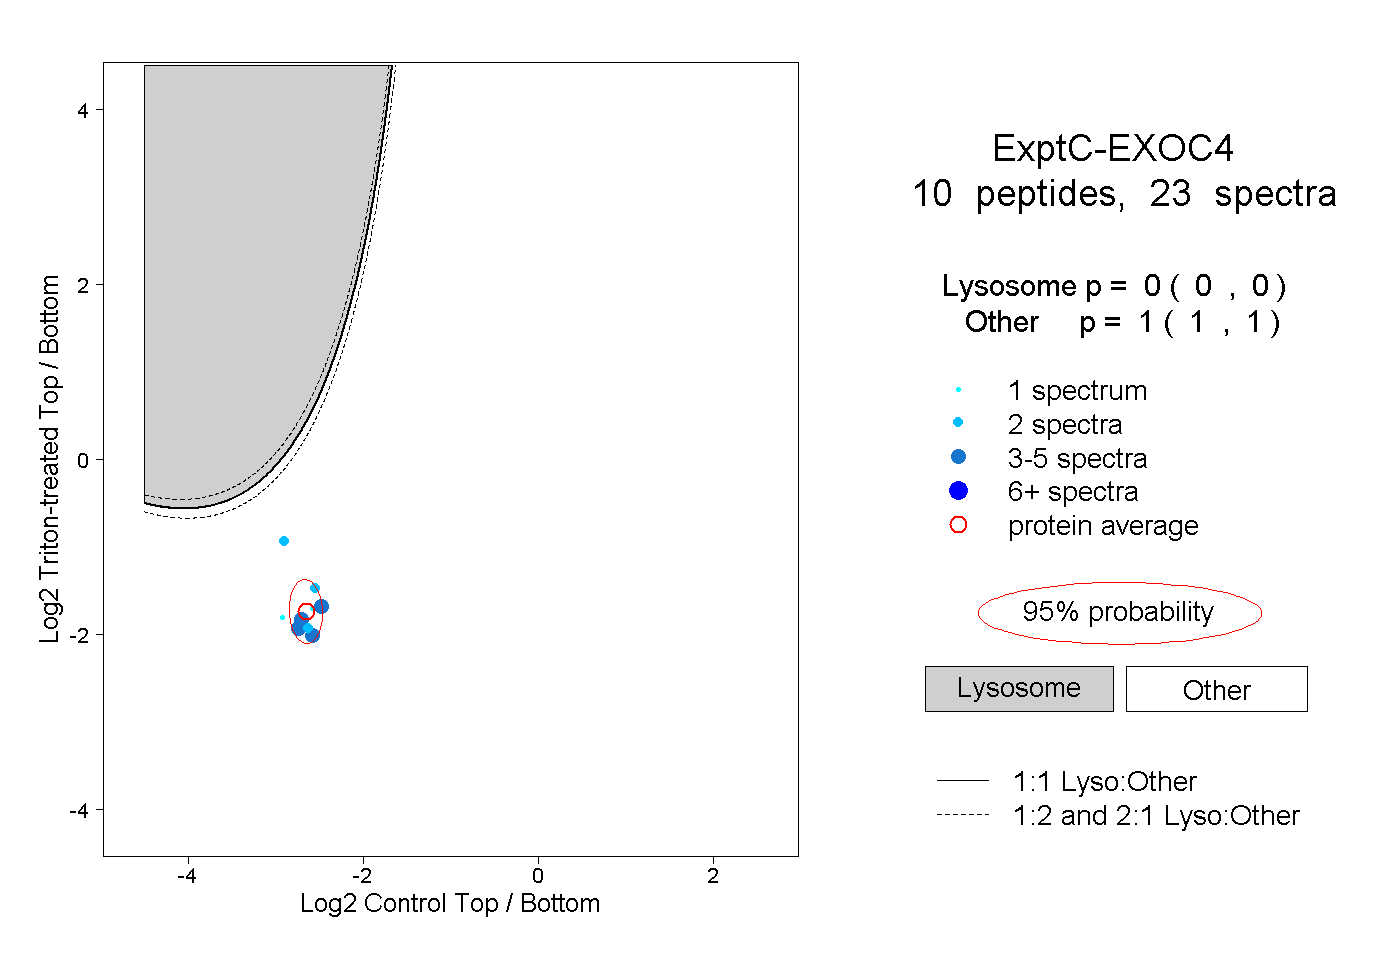
0.000 | 0.000
1.000 | 1.000
2peptides
spectra
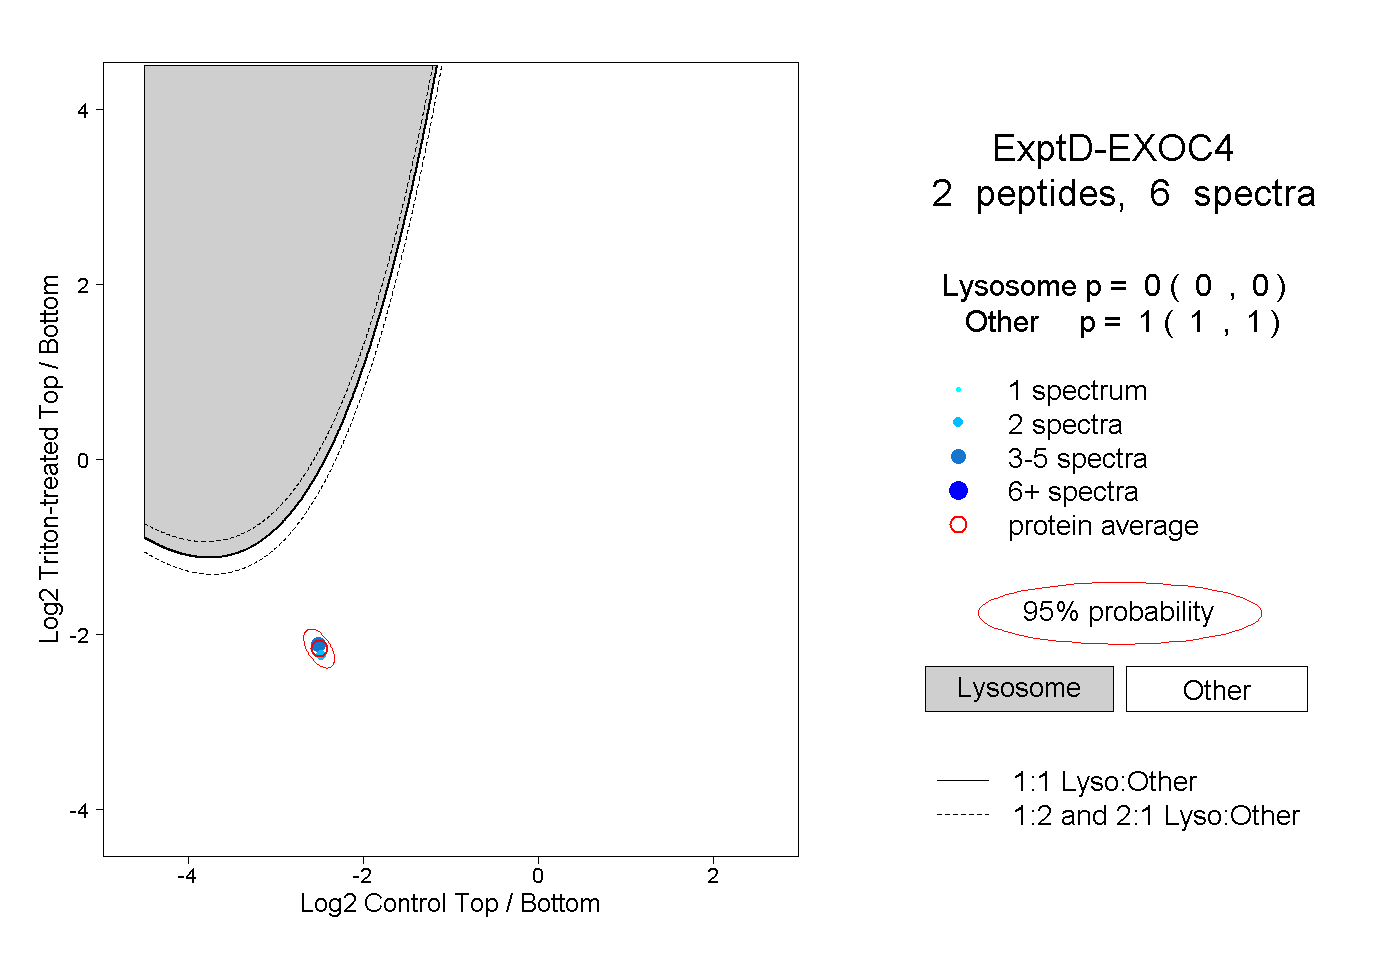
0.000 | 0.000
1.000 | 1.000