 7
7peptides
spectra
0.000 | 0.000
0.000 | 0.000
0.000 | 0.021
0.082 | 0.145
0.000 | 0.000
0.555 | 0.631
0.262 | 0.286
0.000 | 0.013
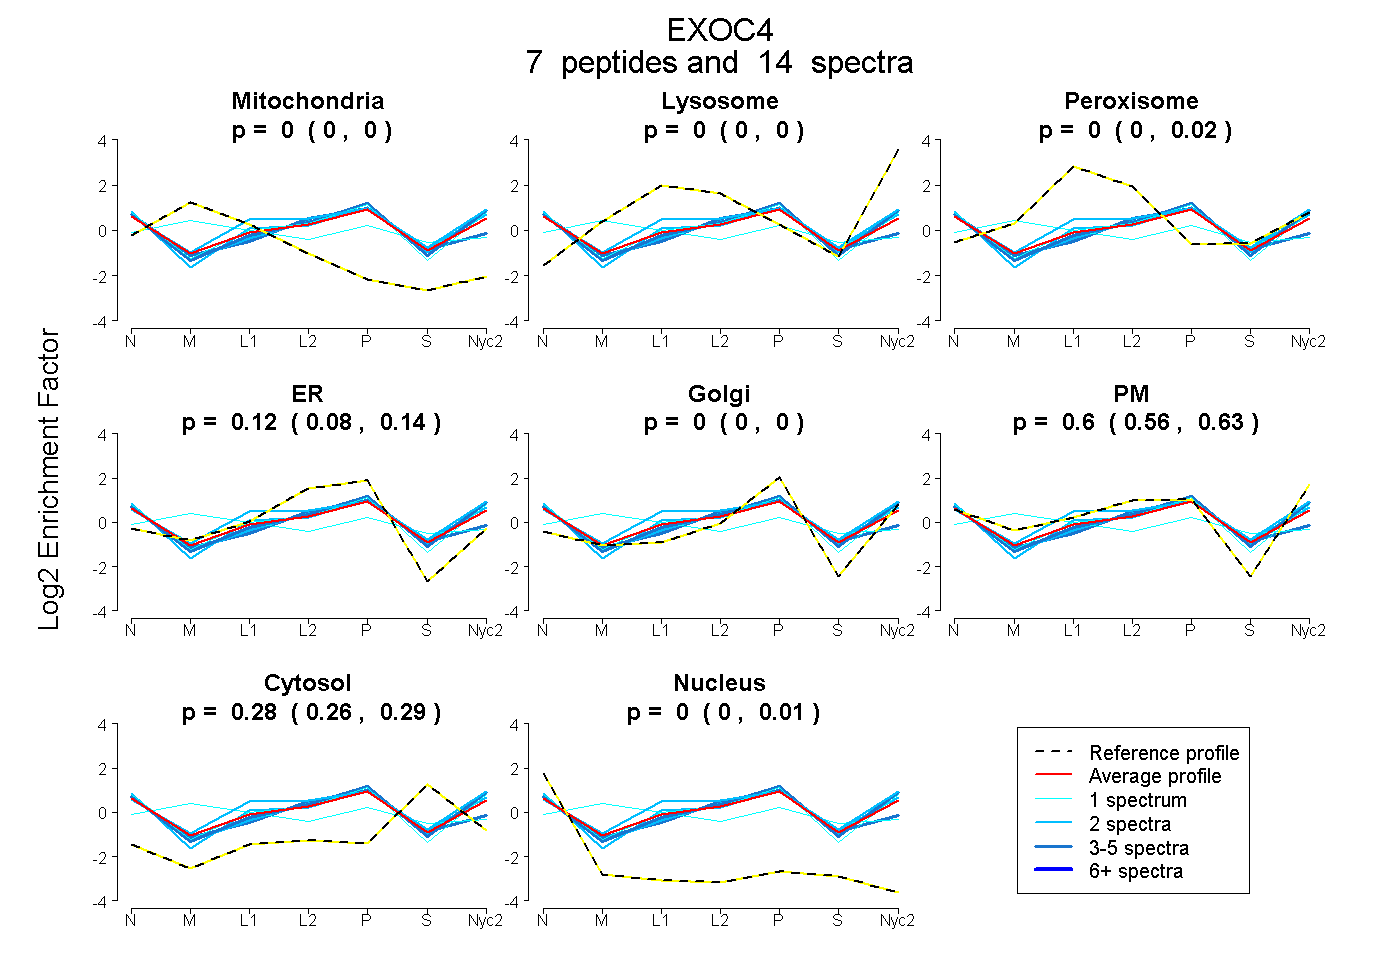
| Plot | Mito | Lyso | Perox | ER | Golgi | PM | Cytosol | Nucleus | |||||
| Expt A |
7 peptides |
14 spectra |
|
0.000 0.000 | 0.000 |
0.000 0.000 | 0.000 |
0.003 0.000 | 0.021 |
0.118 0.082 | 0.145 |
0.000 0.000 | 0.000 |
0.599 0.555 | 0.631 |
0.278 0.262 | 0.286 |
0.002 0.000 | 0.013 |
| 2 spectra, DASPGPLIDVSNISTPR | 0.000 | 0.000 | 0.000 | 0.011 | 0.032 | 0.691 | 0.265 | 0.001 | ||
| 1 spectrum, LEQCMASK | 0.254 | 0.000 | 0.230 | 0.000 | 0.321 | 0.000 | 0.196 | 0.000 | ||
| 2 spectra, GESLTVDNQPR | 0.000 | 0.000 | 0.000 | 0.067 | 0.022 | 0.617 | 0.293 | 0.001 | ||
| 3 spectra, FVCKPGAR | 0.000 | 0.000 | 0.000 | 0.341 | 0.000 | 0.349 | 0.270 | 0.040 | ||
| 2 spectra, TYQSITER | 0.000 | 0.000 | 0.152 | 0.000 | 0.042 | 0.601 | 0.206 | 0.000 | ||
| 3 spectra, LWIEGIEHK | 0.000 | 0.000 | 0.000 | 0.025 | 0.141 | 0.609 | 0.225 | 0.000 | ||
| 1 spectrum, STTQVADSAYQR | 0.000 | 0.000 | 0.000 | 0.057 | 0.077 | 0.658 | 0.183 | 0.025 |
| Plot | Mito | Lyso or Perox | ER | Golgi | PM | Cytosol | Nucleus | ||||||
| Expt B |
2 peptides |
3 spectra |
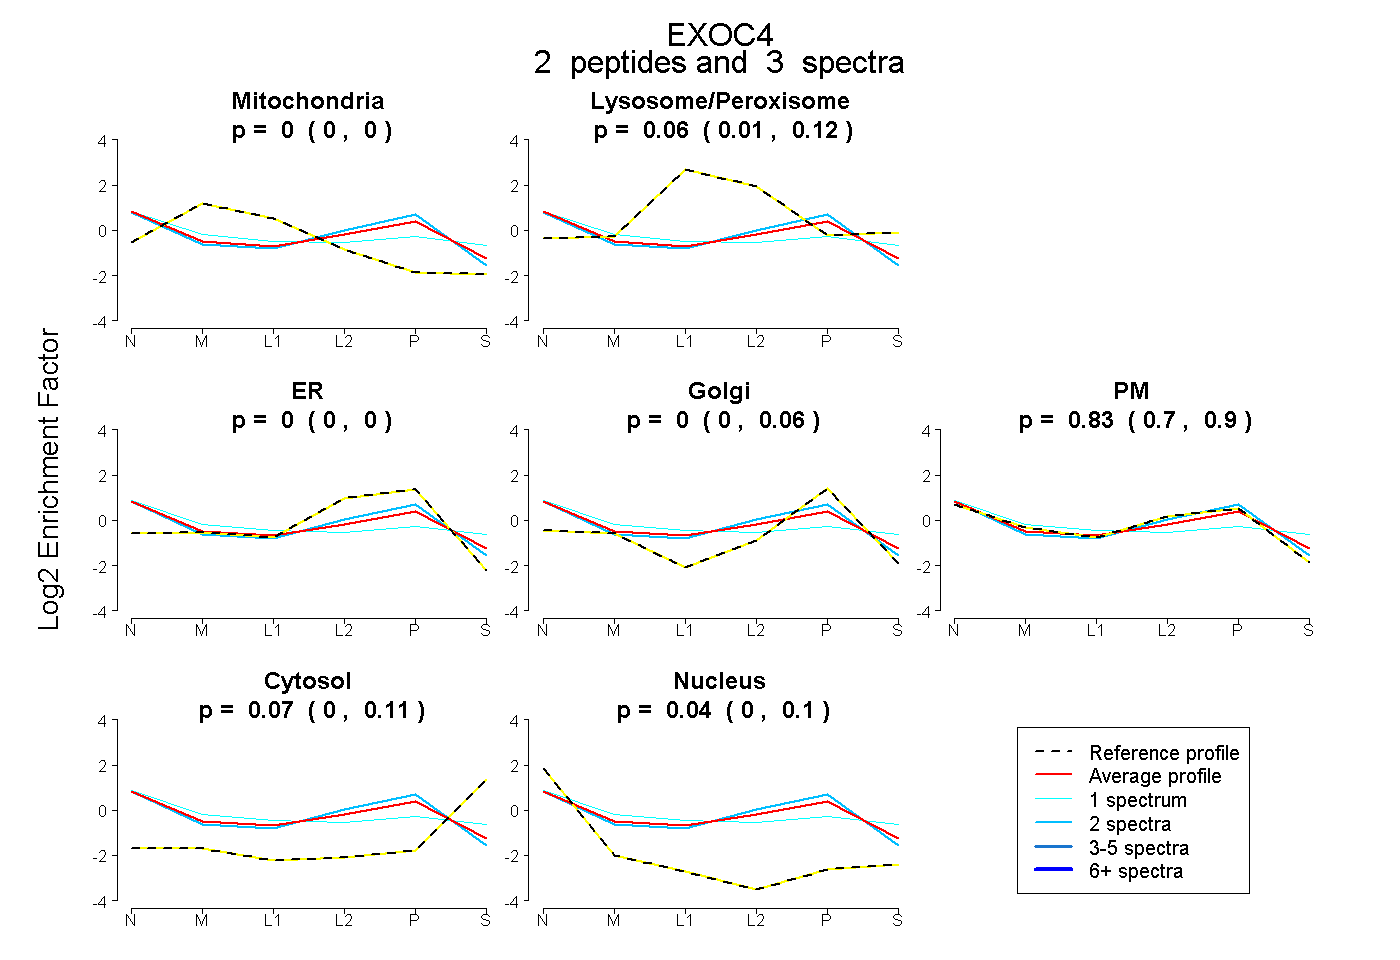 |
0.000 0.000 | 0.000 |
0.062 0.011 | 0.119 |
0.000 0.000 | 0.000 |
0.000 0.000 | 0.058 |
0.827 0.699 | 0.903 |
0.071 0.004 | 0.111 |
0.040 0.000 | 0.103 |
|||
| Plot | Lyso | Other | |||||||||||
| Expt C |
10 peptides |
23 spectra |
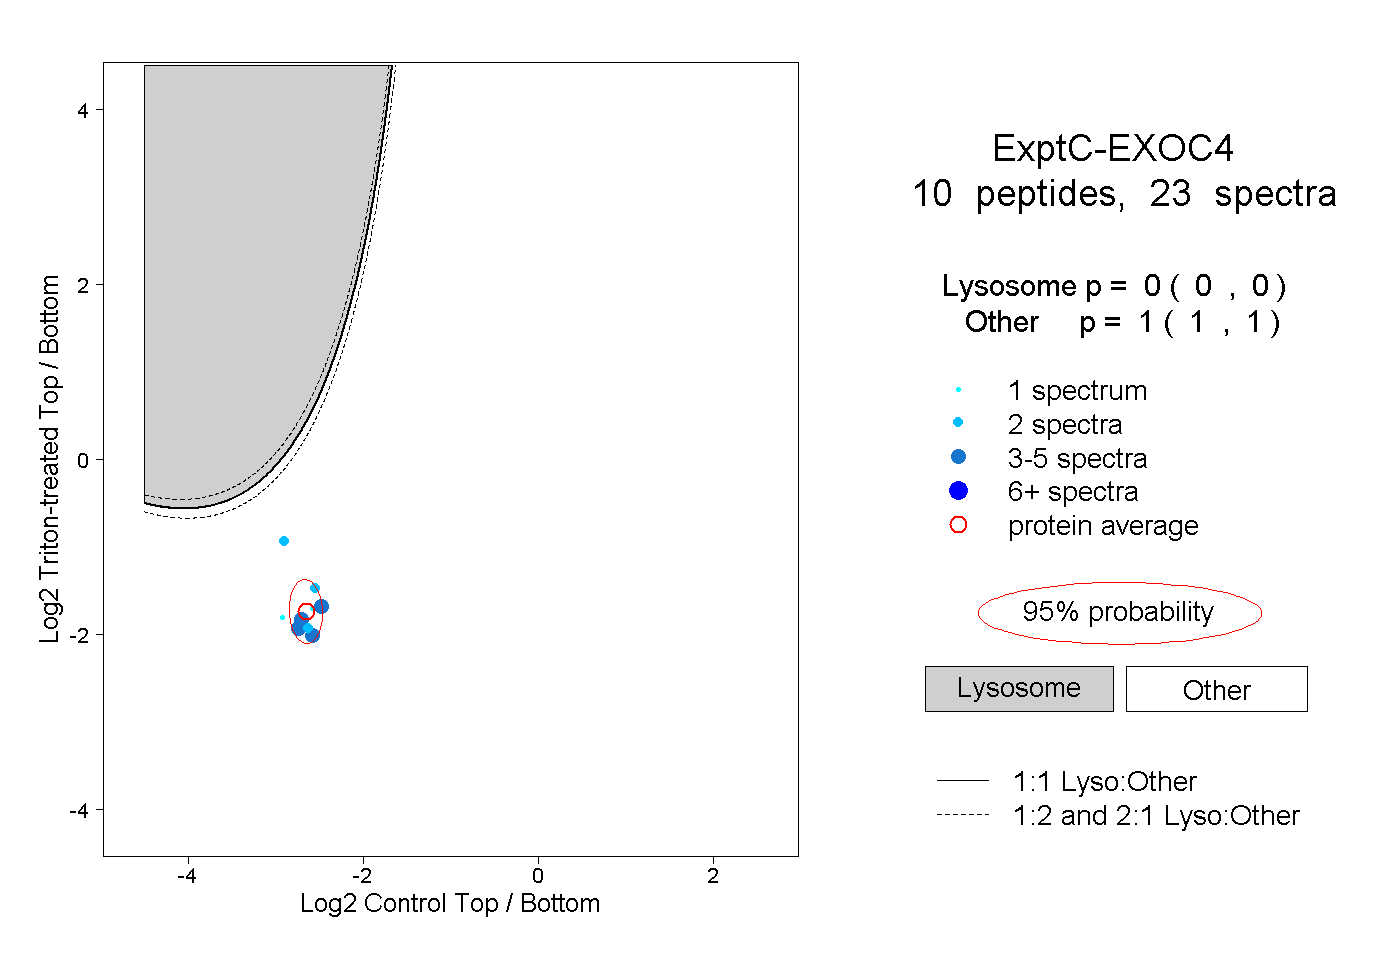 |
0.000 0.000 | 0.000 |
1.000 1.000 | 1.000 |
||||||||
| Plot | Lyso | Other | |||||||||||
| Expt D |
2 peptides |
6 spectra |
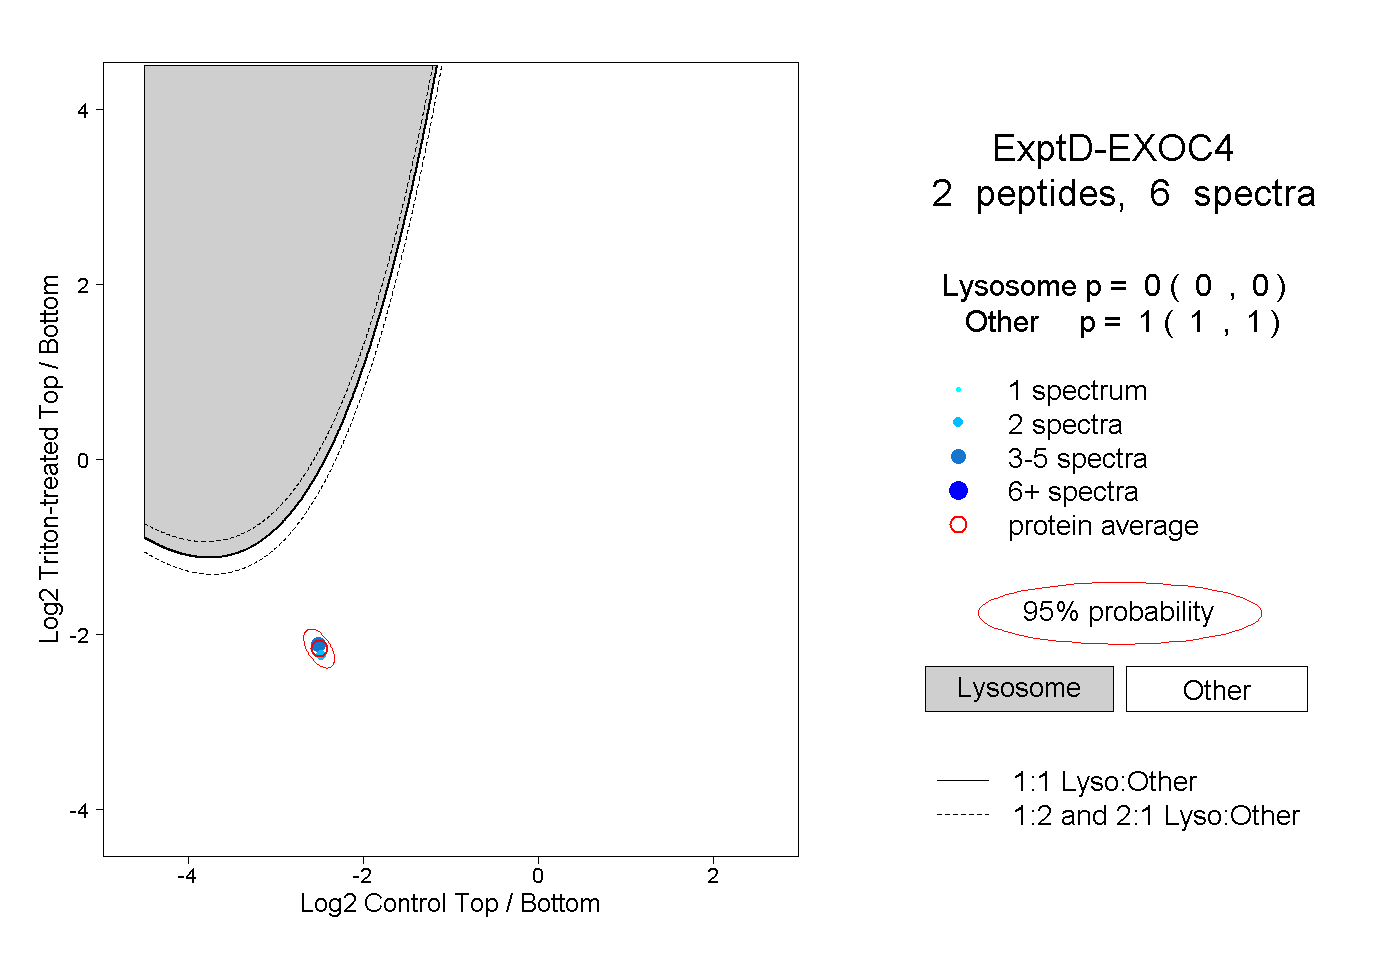 |
0.000 0.000 | 0.000 |
1.000 1.000 | 1.000 |