 5
5peptides
spectra
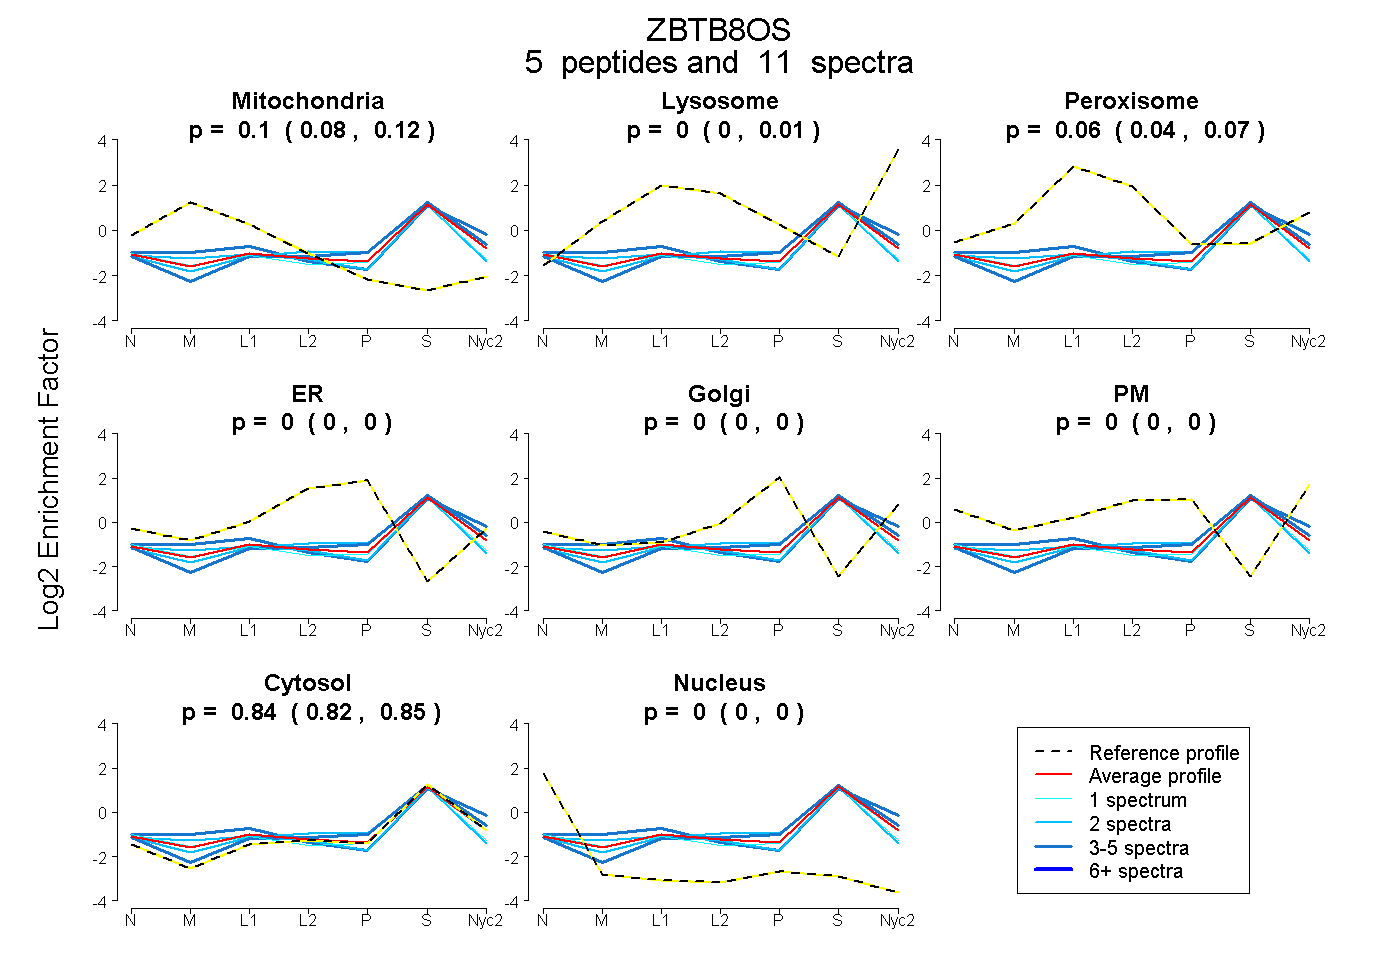
0.082 | 0.118
0.000 | 0.012
0.045 | 0.075
0.000 | 0.000
0.000 | 0.000
0.000 | 0.000
0.819 | 0.849
0.000 | 0.000
1peptide
spectrum
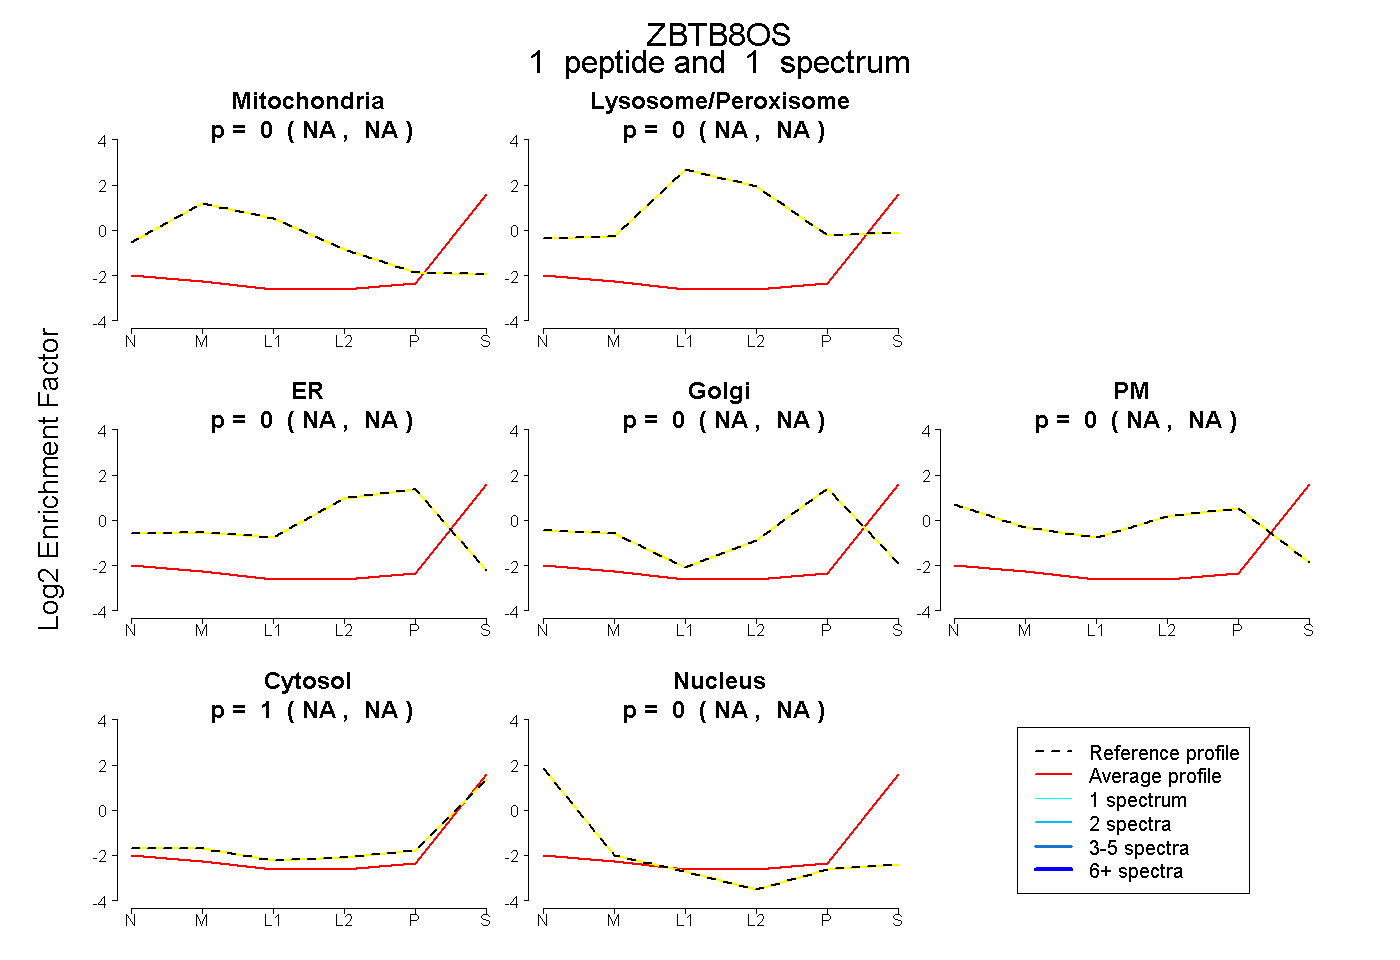
NA | NA
NA | NA
NA | NA
NA | NA
NA | NA
NA | NA
NA | NA
3peptides
spectra
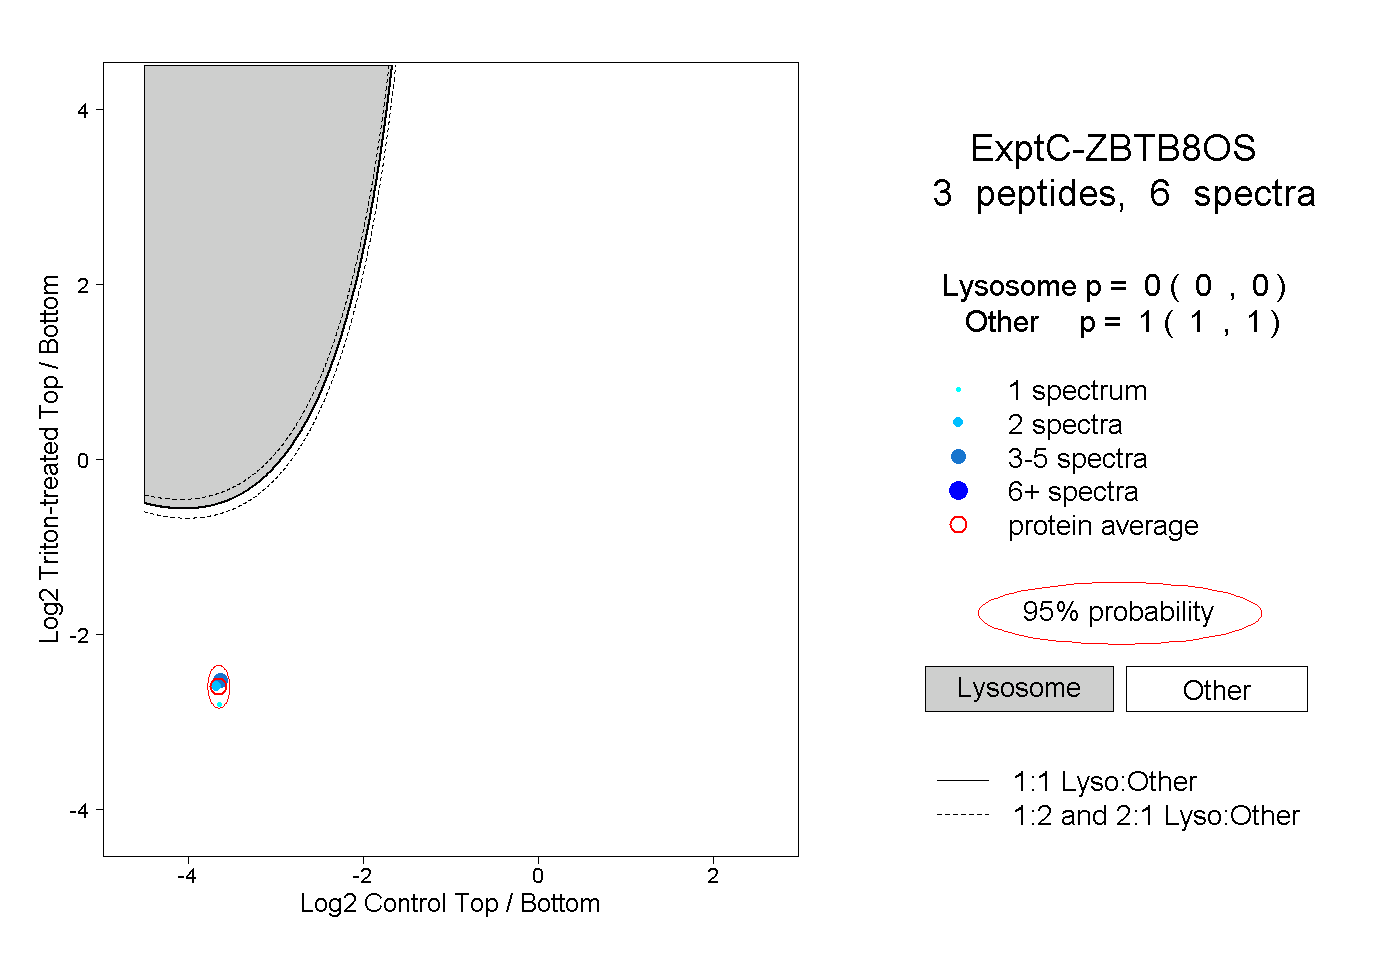
0.000 | 0.000
1.000 | 1.000