 5
5peptides
spectra
0.082 | 0.118
0.000 | 0.012
0.045 | 0.075
0.000 | 0.000
0.000 | 0.000
0.000 | 0.000
0.819 | 0.849
0.000 | 0.000
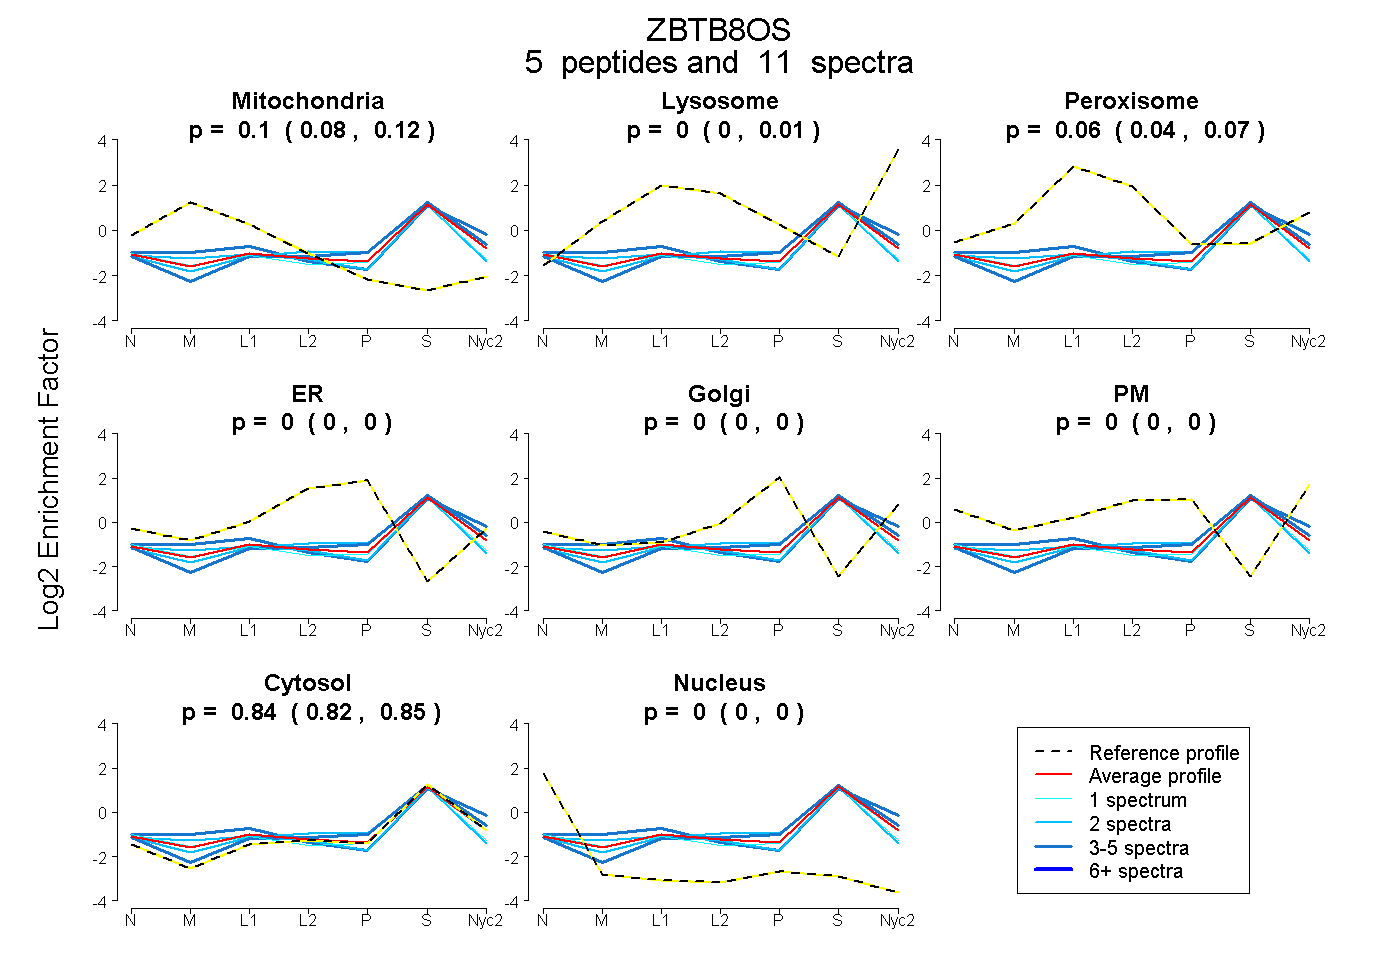
| Plot | Mito | Lyso | Perox | ER | Golgi | PM | Cytosol | Nucleus | |||||
| Expt A |
5 peptides |
11 spectra |
|
0.101 0.082 | 0.118 |
0.000 0.000 | 0.012 |
0.063 0.045 | 0.075 |
0.000 0.000 | 0.000 |
0.000 0.000 | 0.000 |
0.000 0.000 | 0.000 |
0.836 0.819 | 0.849 |
0.000 0.000 | 0.000 |
| 2 spectra, HPQGTEVK | 0.077 | 0.000 | 0.018 | 0.050 | 0.000 | 0.000 | 0.855 | 0.000 | ||
| 1 spectrum, VLNIDQK | 0.157 | 0.000 | 0.000 | 0.000 | 0.000 | 0.000 | 0.843 | 0.000 | ||
| 3 spectra, DYNLTEEQK | 0.152 | 0.113 | 0.000 | 0.000 | 0.000 | 0.000 | 0.735 | 0.000 | ||
| 2 spectra, FSADEYFIPR | 0.157 | 0.000 | 0.036 | 0.000 | 0.000 | 0.000 | 0.806 | 0.000 | ||
| 3 spectra, SIGWGEEFSLSK | 0.000 | 0.000 | 0.042 | 0.000 | 0.037 | 0.022 | 0.899 | 0.000 |
| Plot | Mito | Lyso or Perox | ER | Golgi | PM | Cytosol | Nucleus | ||||||
| Expt B |
1 peptide |
1 spectrum |
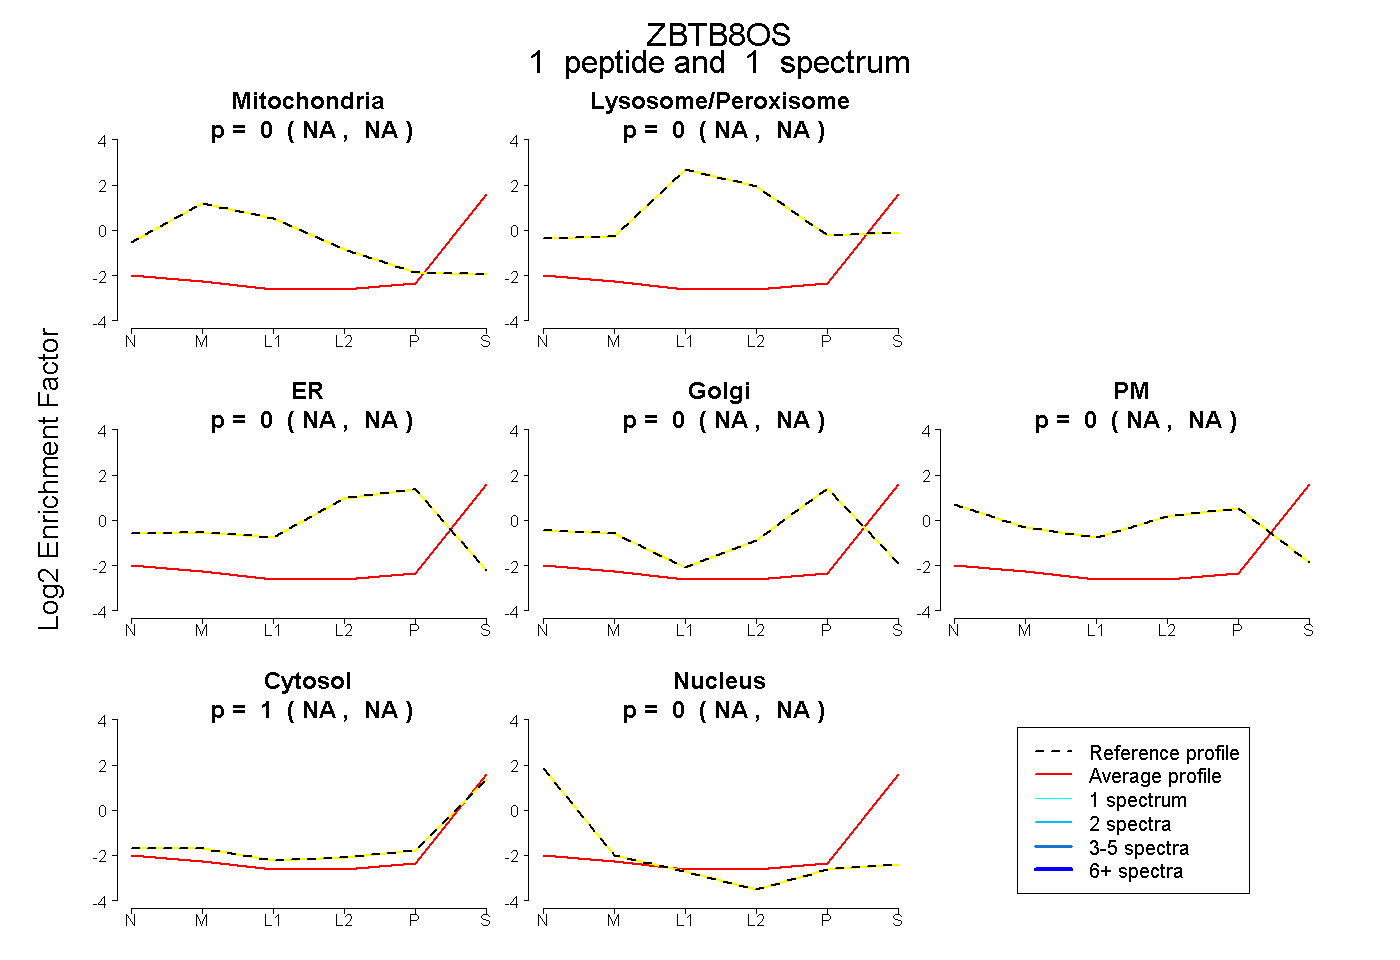 |
0.000 NA | NA |
0.000 NA | NA |
0.000 NA | NA |
0.000 NA | NA |
0.000 NA | NA |
1.000 NA | NA |
0.000 NA | NA |
|||
| Plot | Lyso | Other | |||||||||||
| Expt C |
3 peptides |
6 spectra |
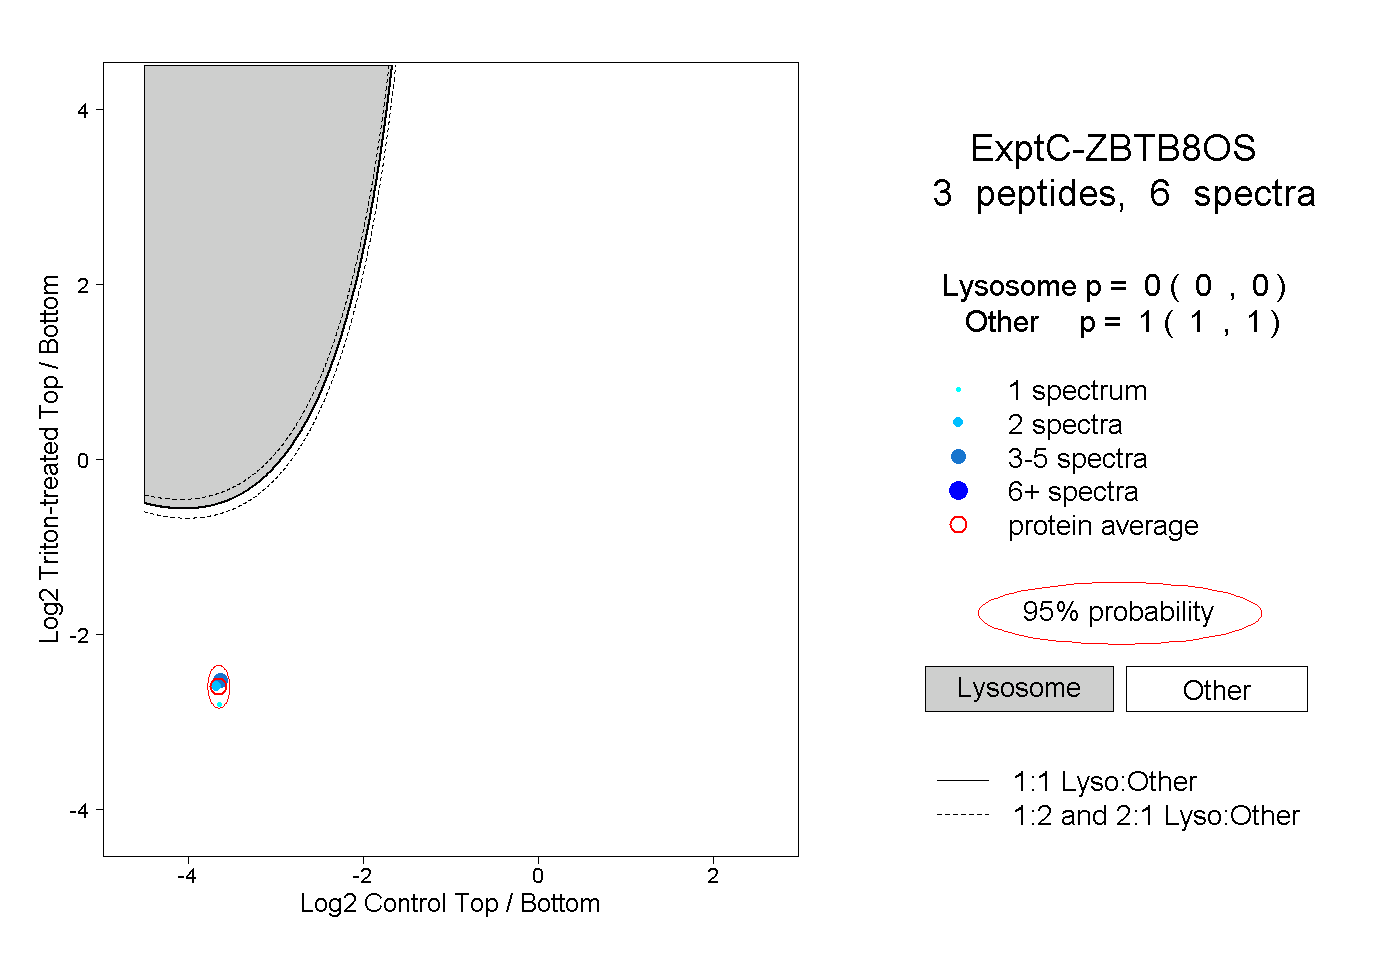 |
0.000 0.000 | 0.000 |
1.000 1.000 | 1.000 |