 7
7peptides
spectra
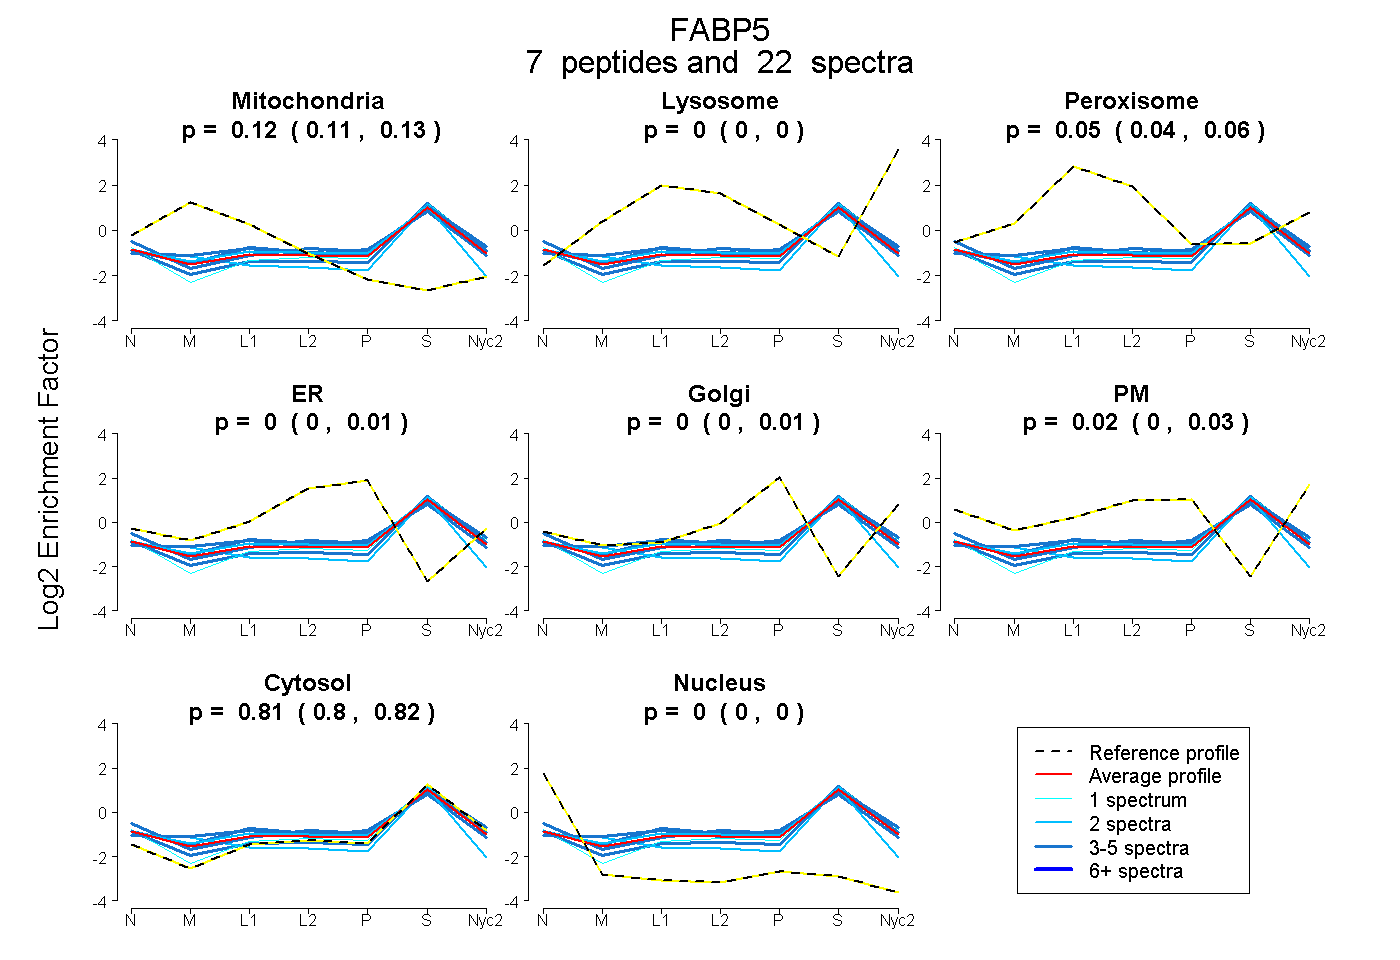
0.113 | 0.133
0.000 | 0.000
0.037 | 0.059
0.000 | 0.009
0.000 | 0.013
0.000 | 0.026
0.801 | 0.817
0.000 | 0.000
3peptides
spectra
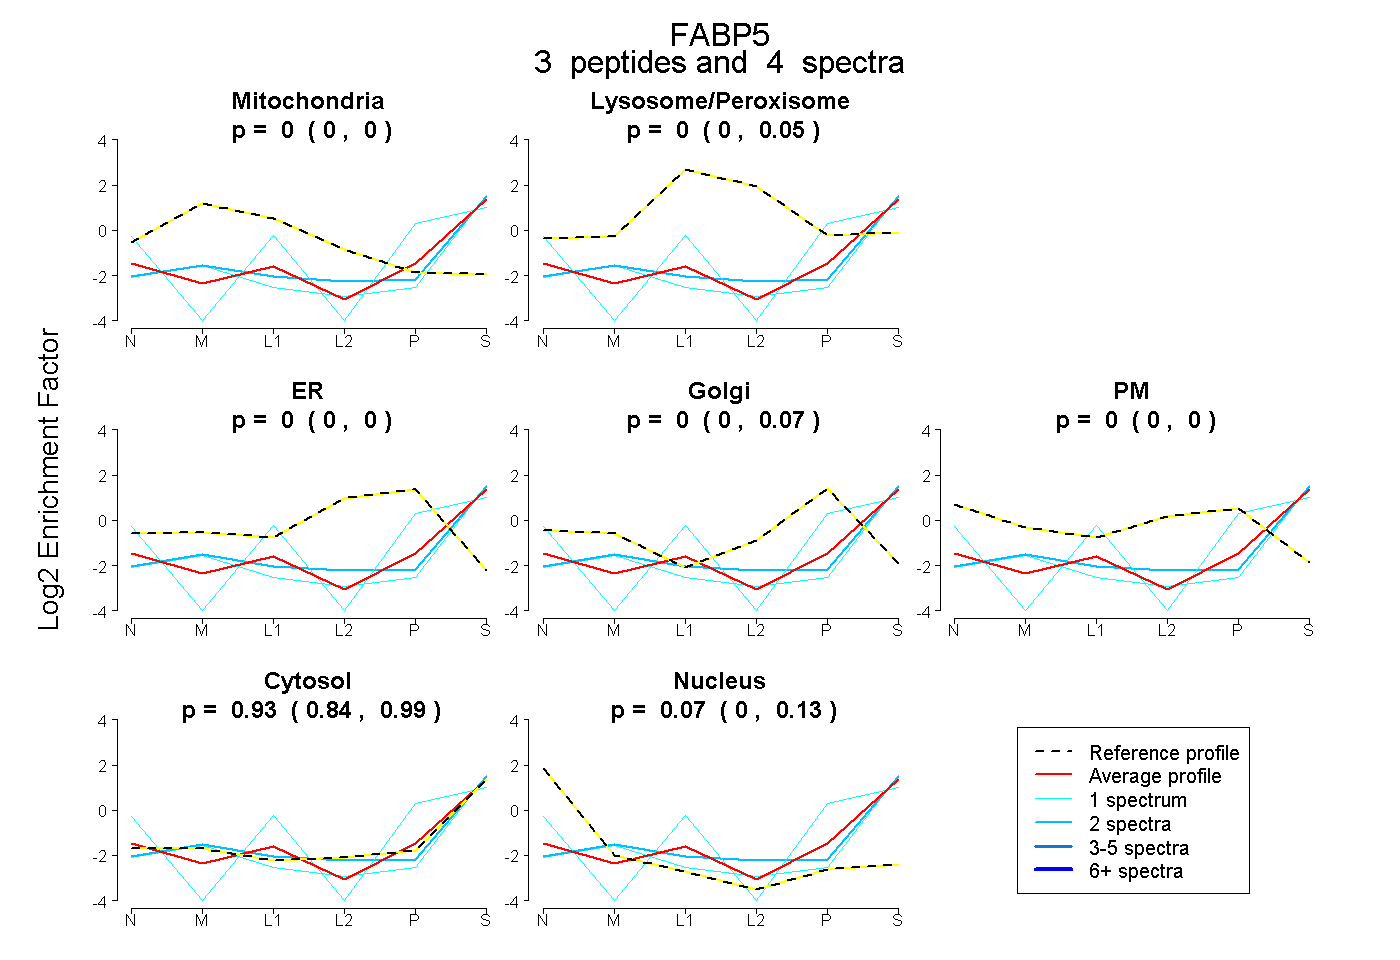
0.000 | 0.000
0.000 | 0.046
0.000 | 0.000
0.000 | 0.068
0.000 | 0.000
0.842 | 0.987
0.000 | 0.133
8peptides
spectra
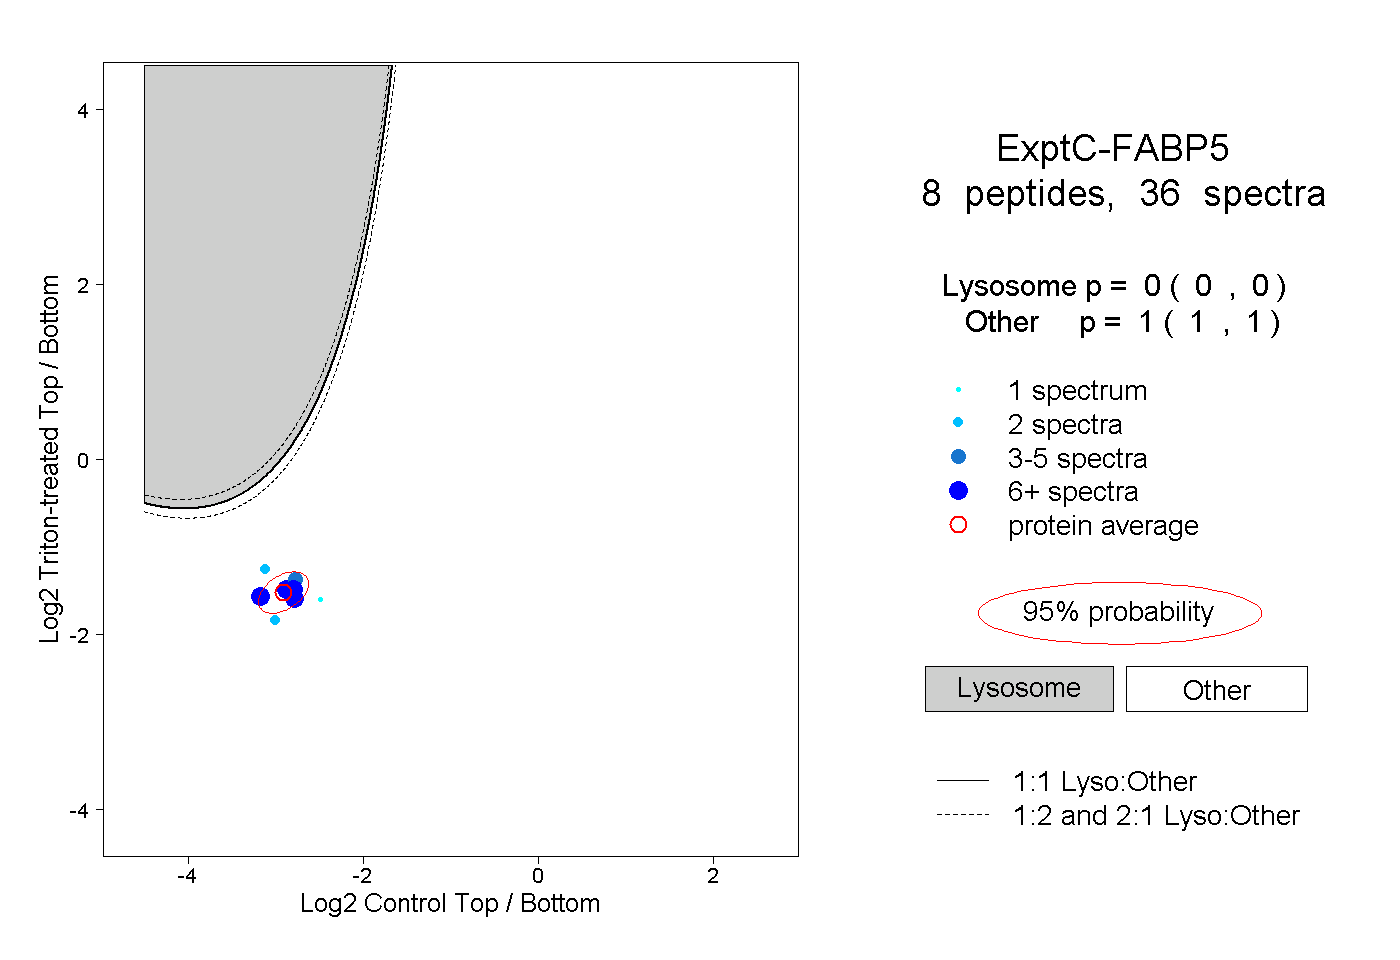
0.000 | 0.000
1.000 | 1.000
2peptides
spectra
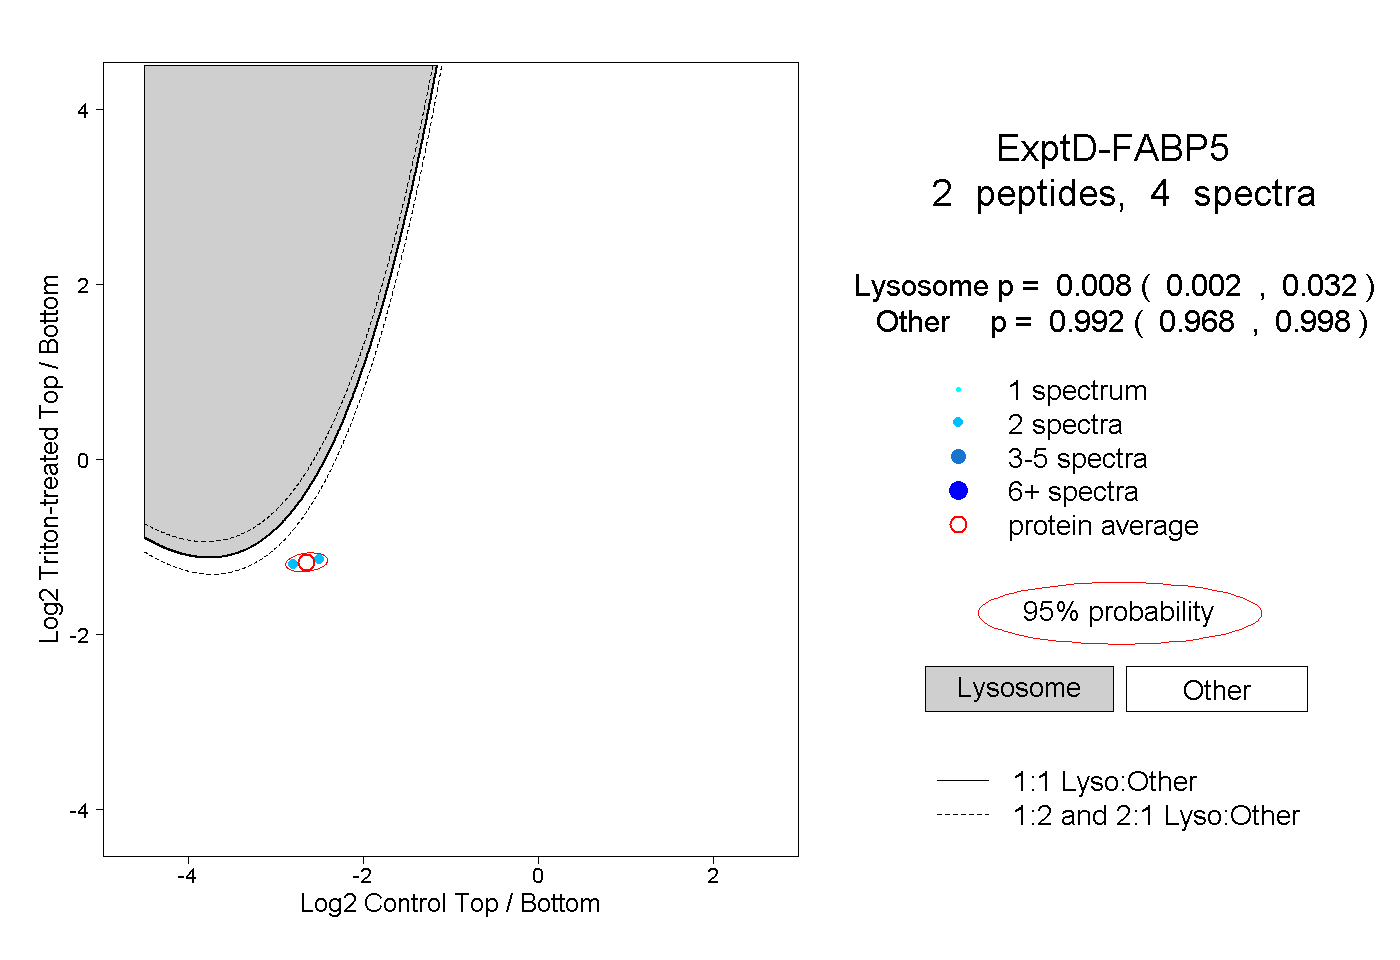
0.002 | 0.032
0.968 | 0.998