 7
7peptides
spectra
0.113 | 0.133
0.000 | 0.000
0.037 | 0.059
0.000 | 0.009
0.000 | 0.013
0.000 | 0.026
0.801 | 0.817
0.000 | 0.000
| Plot | Mito | Lyso | Perox | ER | Golgi | PM | Cytosol | Nucleus | |||||
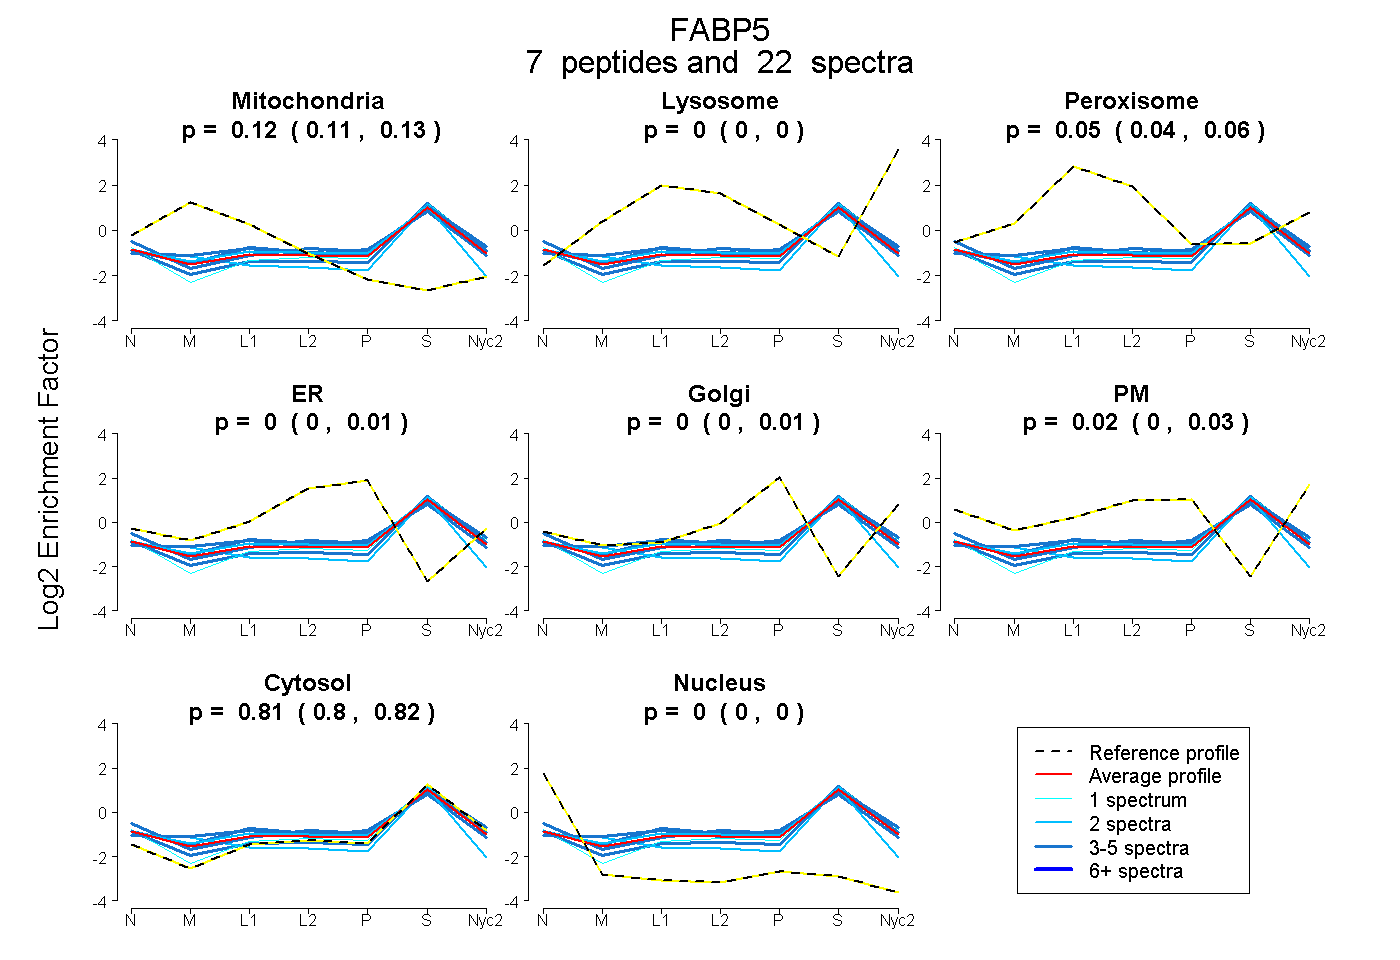
| Expt A |
7 peptides |
22 spectra |
|
0.124 0.113 | 0.133 |
0.000 0.000 | 0.000 |
0.049 0.037 | 0.059 |
0.000 0.000 | 0.009 |
0.000 0.000 | 0.013 |
0.017 0.000 | 0.026 |
0.810 0.801 | 0.817 |
0.000 0.000 | 0.000 |
| 4 spectra, MVVECVMNNAICTR | 0.166 | 0.000 | 0.076 | 0.008 | 0.033 | 0.000 | 0.717 | 0.000 | ||
| 2 spectra, FDETTADGR | 0.177 | 0.000 | 0.000 | 0.000 | 0.000 | 0.000 | 0.823 | 0.000 | ||
| 4 spectra, ELGVGLALR | 0.084 | 0.000 | 0.000 | 0.000 | 0.000 | 0.007 | 0.897 | 0.012 | ||
| 4 spectra, TESTVK | 0.010 | 0.000 | 0.105 | 0.022 | 0.000 | 0.051 | 0.750 | 0.062 | ||
| 2 spectra, TETVCTFTDGALVQHQK | 0.210 | 0.000 | 0.000 | 0.013 | 0.000 | 0.000 | 0.777 | 0.000 | ||
| 5 spectra, LVESHGFEDYMK | 0.073 | 0.000 | 0.135 | 0.000 | 0.000 | 0.018 | 0.773 | 0.000 | ||
| 1 spectrum, ESTITR | 0.000 | 0.000 | 0.029 | 0.000 | 0.000 | 0.043 | 0.889 | 0.040 |
| Plot | Mito | Lyso or Perox | ER | Golgi | PM | Cytosol | Nucleus | ||||||
| Expt B |
3 peptides |
4 spectra |
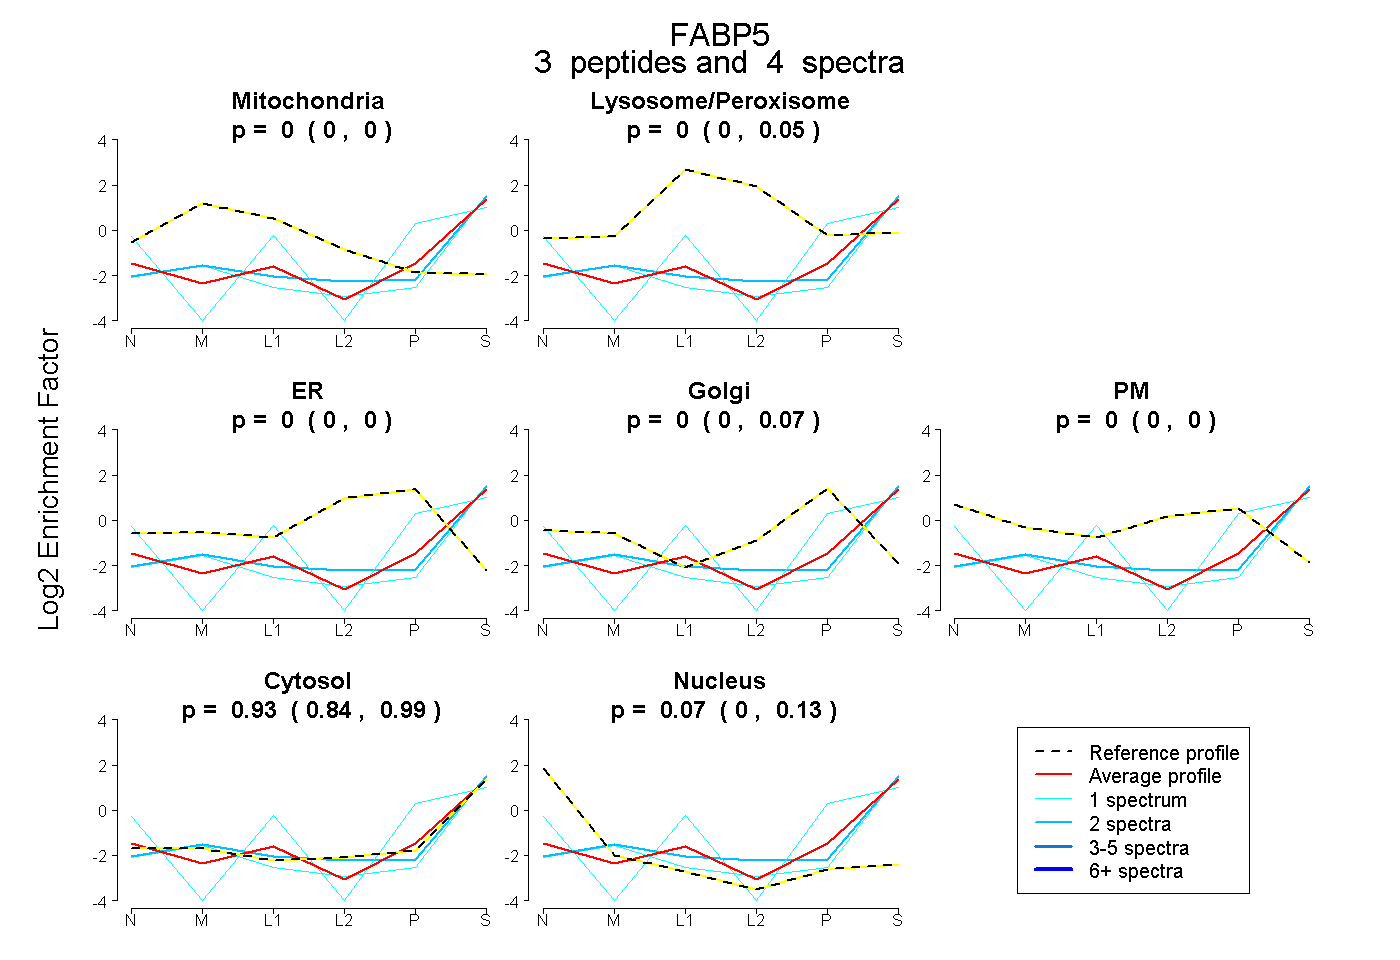 |
0.000 0.000 | 0.000 |
0.000 0.000 | 0.046 |
0.000 0.000 | 0.000 |
0.000 0.000 | 0.068 |
0.000 0.000 | 0.000 |
0.933 0.842 | 0.987 |
0.067 0.000 | 0.133 |
|||
| Plot | Lyso | Other | |||||||||||
| Expt C |
8 peptides |
36 spectra |
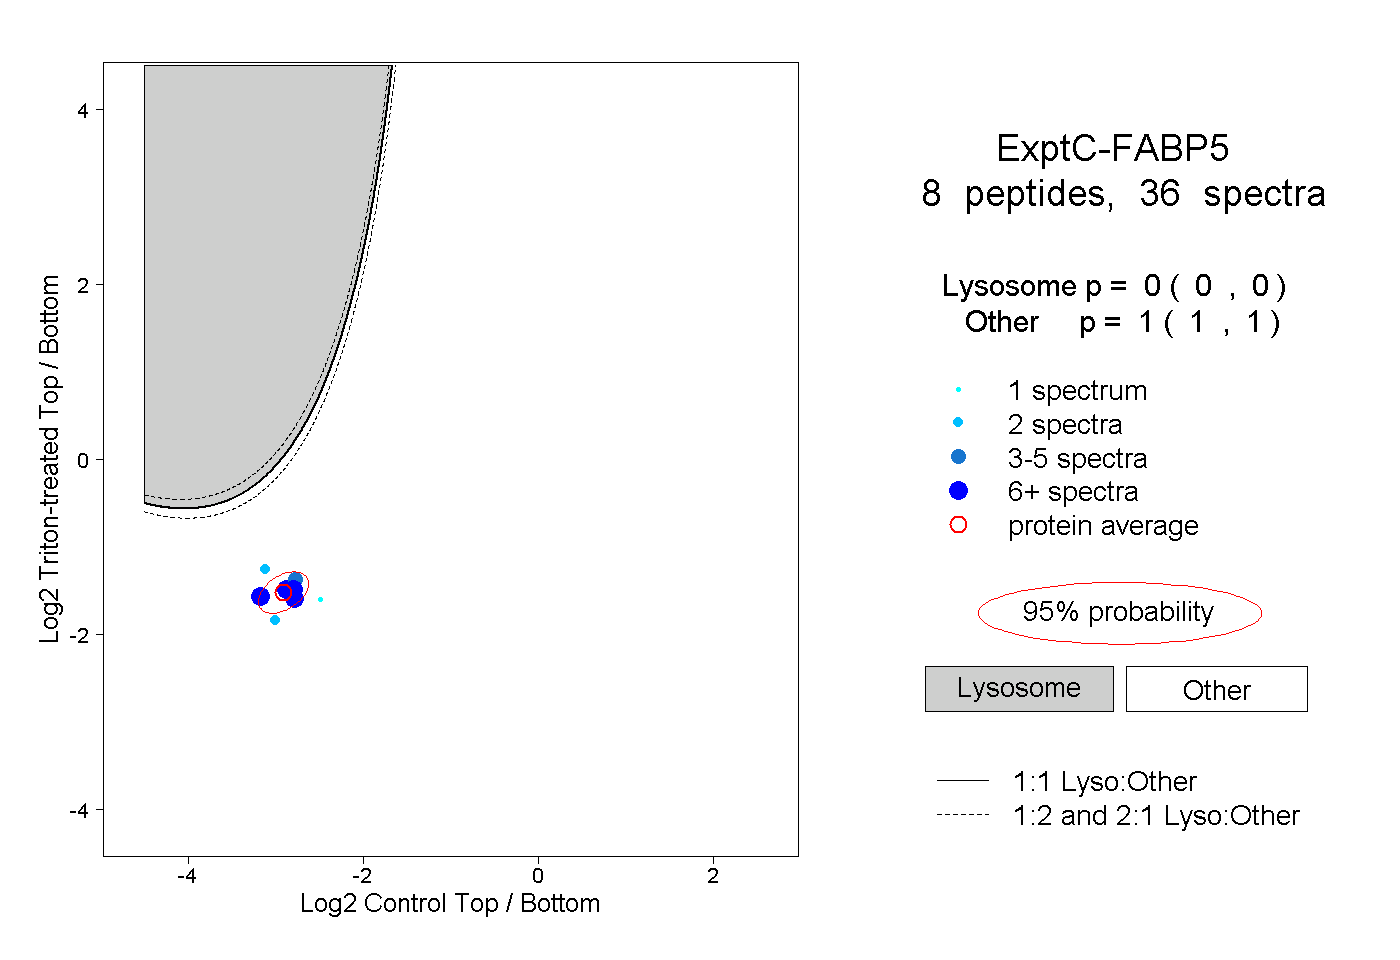 |
0.000 0.000 | 0.000 |
1.000 1.000 | 1.000 |
||||||||
| Plot | Lyso | Other | |||||||||||
| Expt D |
2 peptides |
4 spectra |
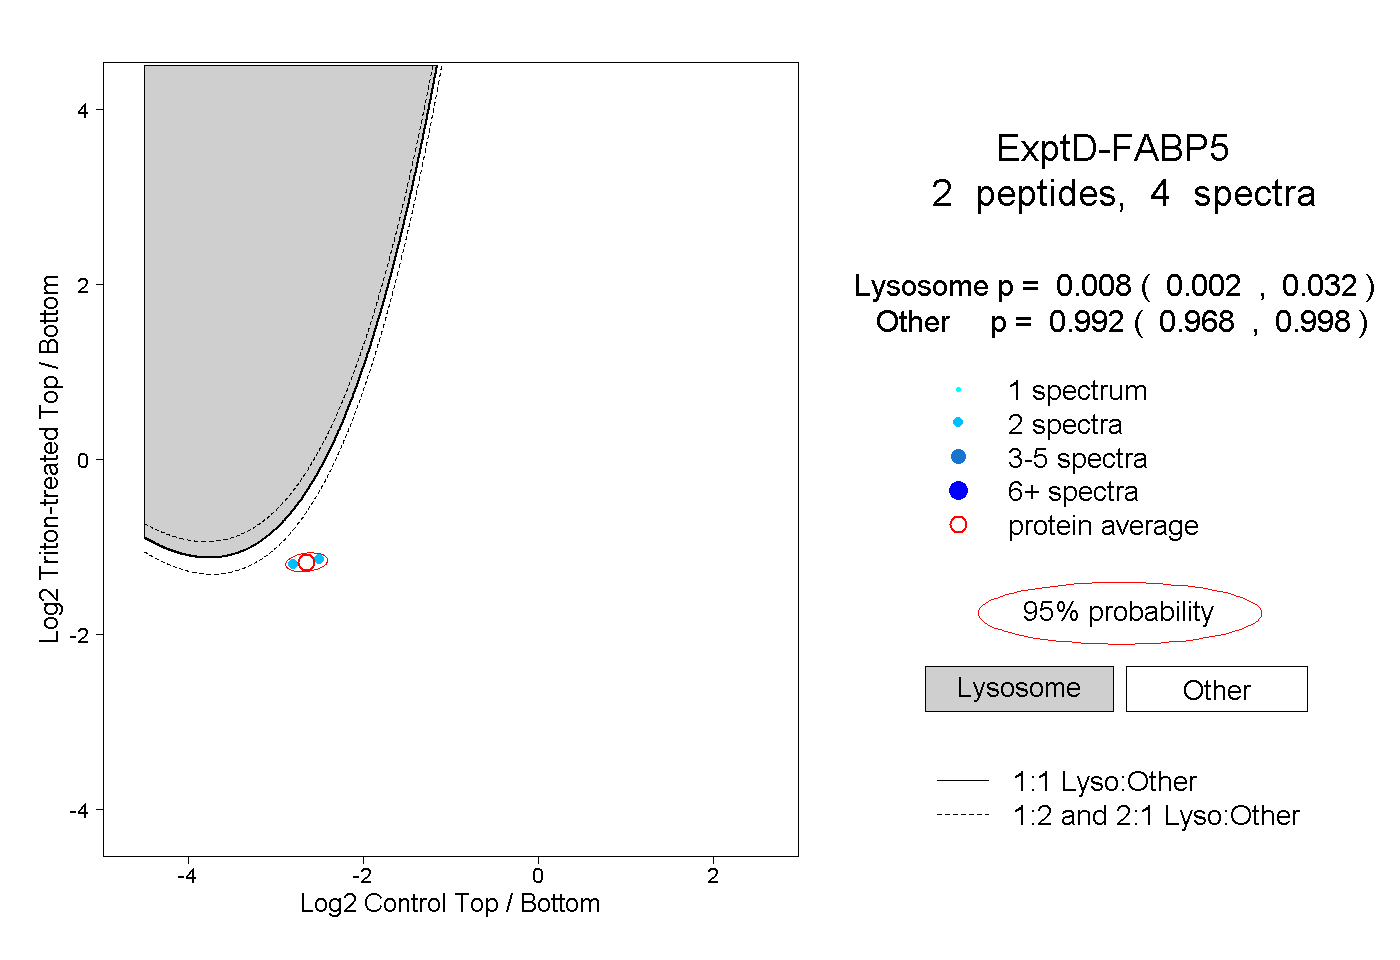 |
0.008 0.002 | 0.032 |
0.992 0.968 | 0.998 |