 8
8peptides
spectra
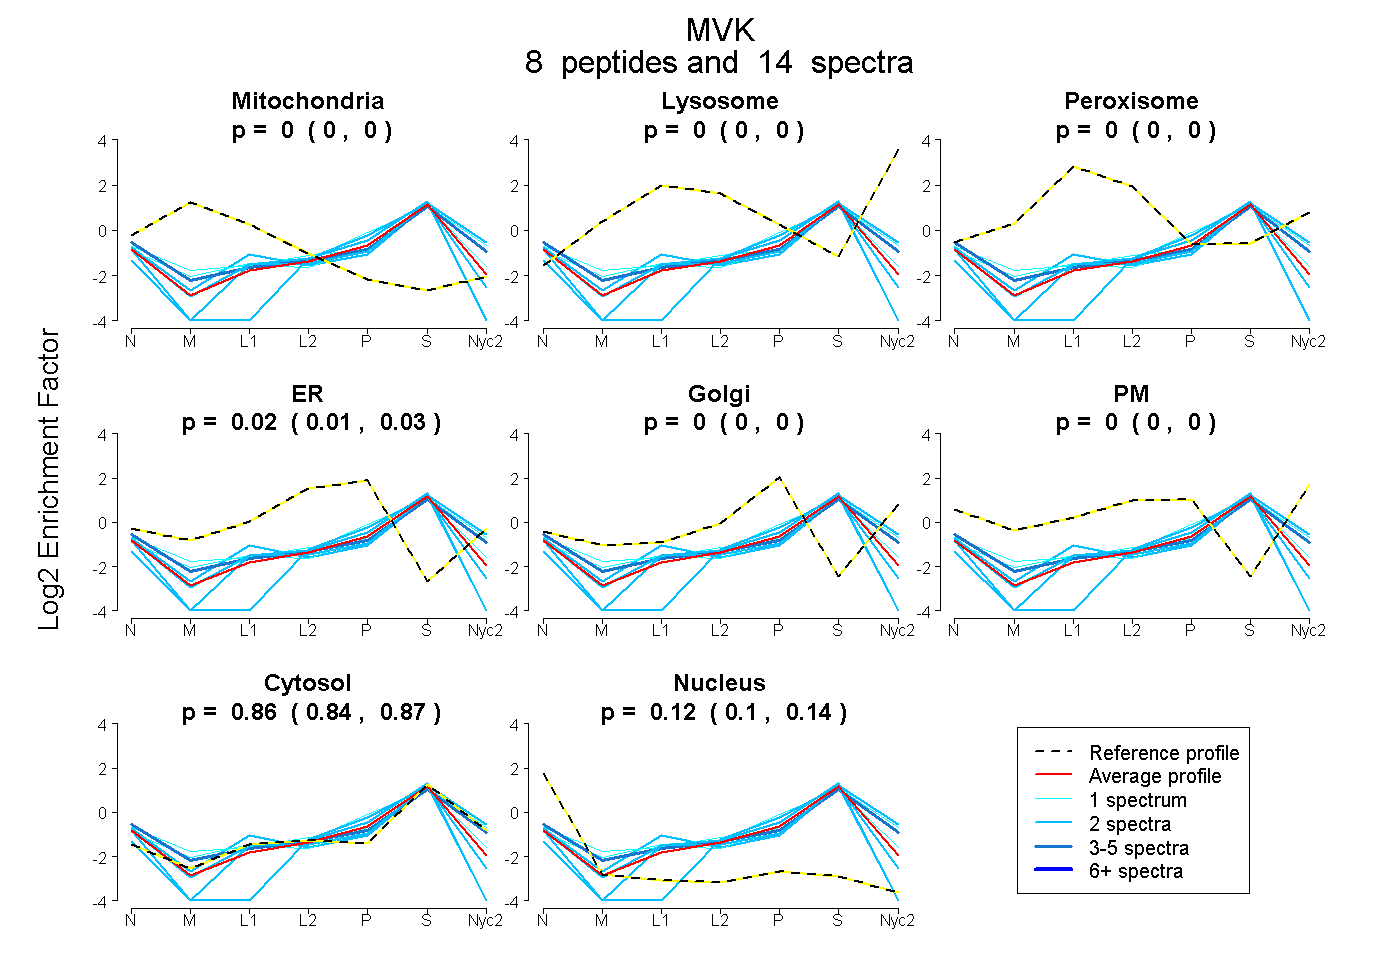
0.000 | 0.000
0.000 | 0.000
0.000 | 0.000
0.007 | 0.033
0.000 | 0.000
0.000 | 0.000
0.844 | 0.870
0.099 | 0.138
3peptides
spectra
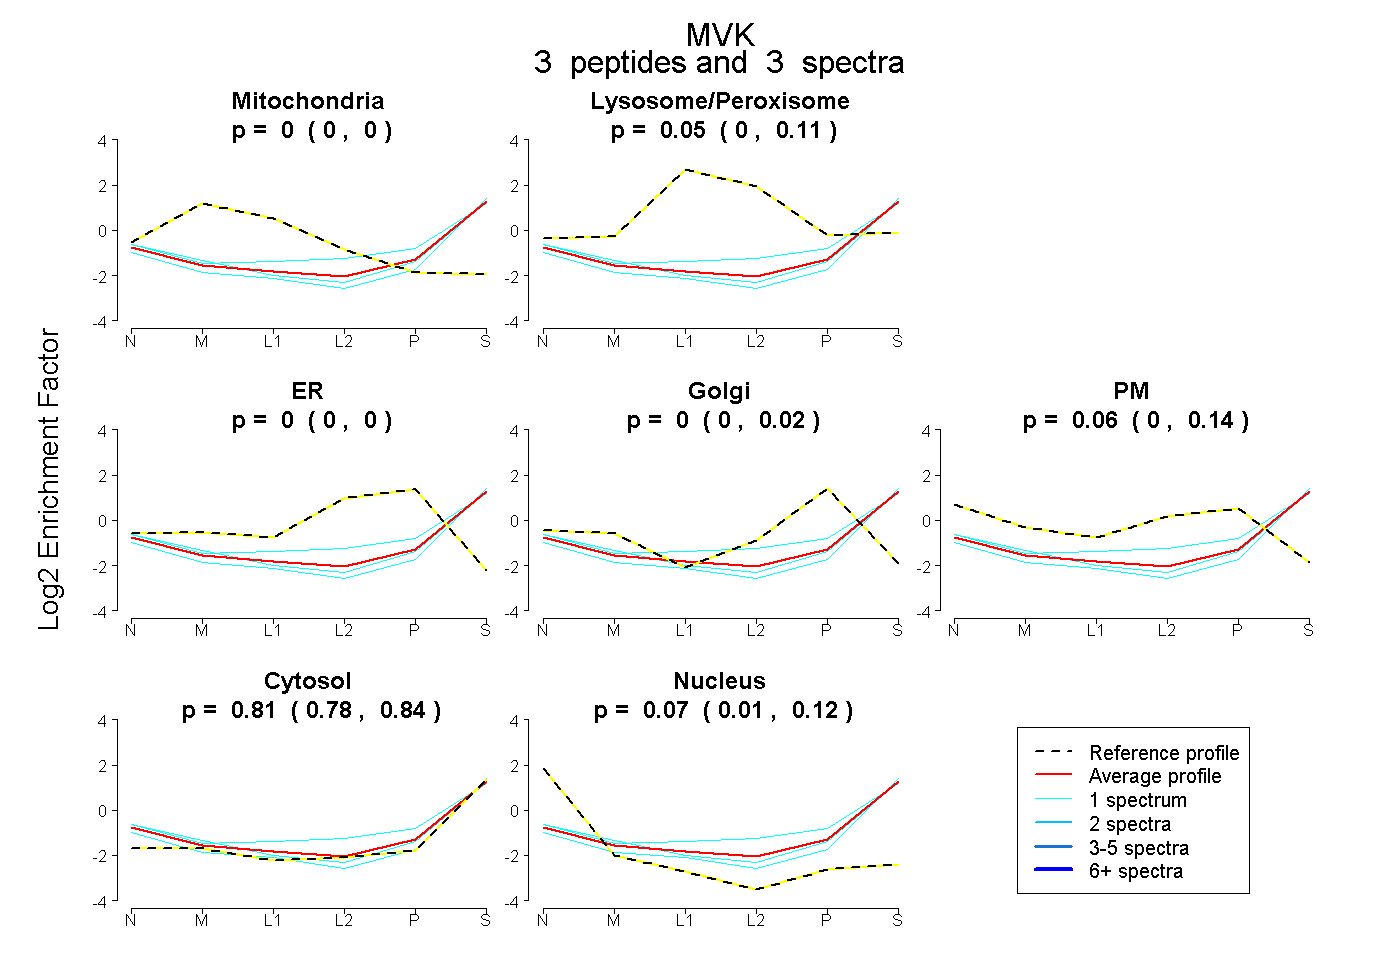
0.000 | 0.000
0.000 | 0.106
0.000 | 0.000
0.000 | 0.020
0.000 | 0.144
0.776 | 0.840
0.010 | 0.123
5peptides
spectra
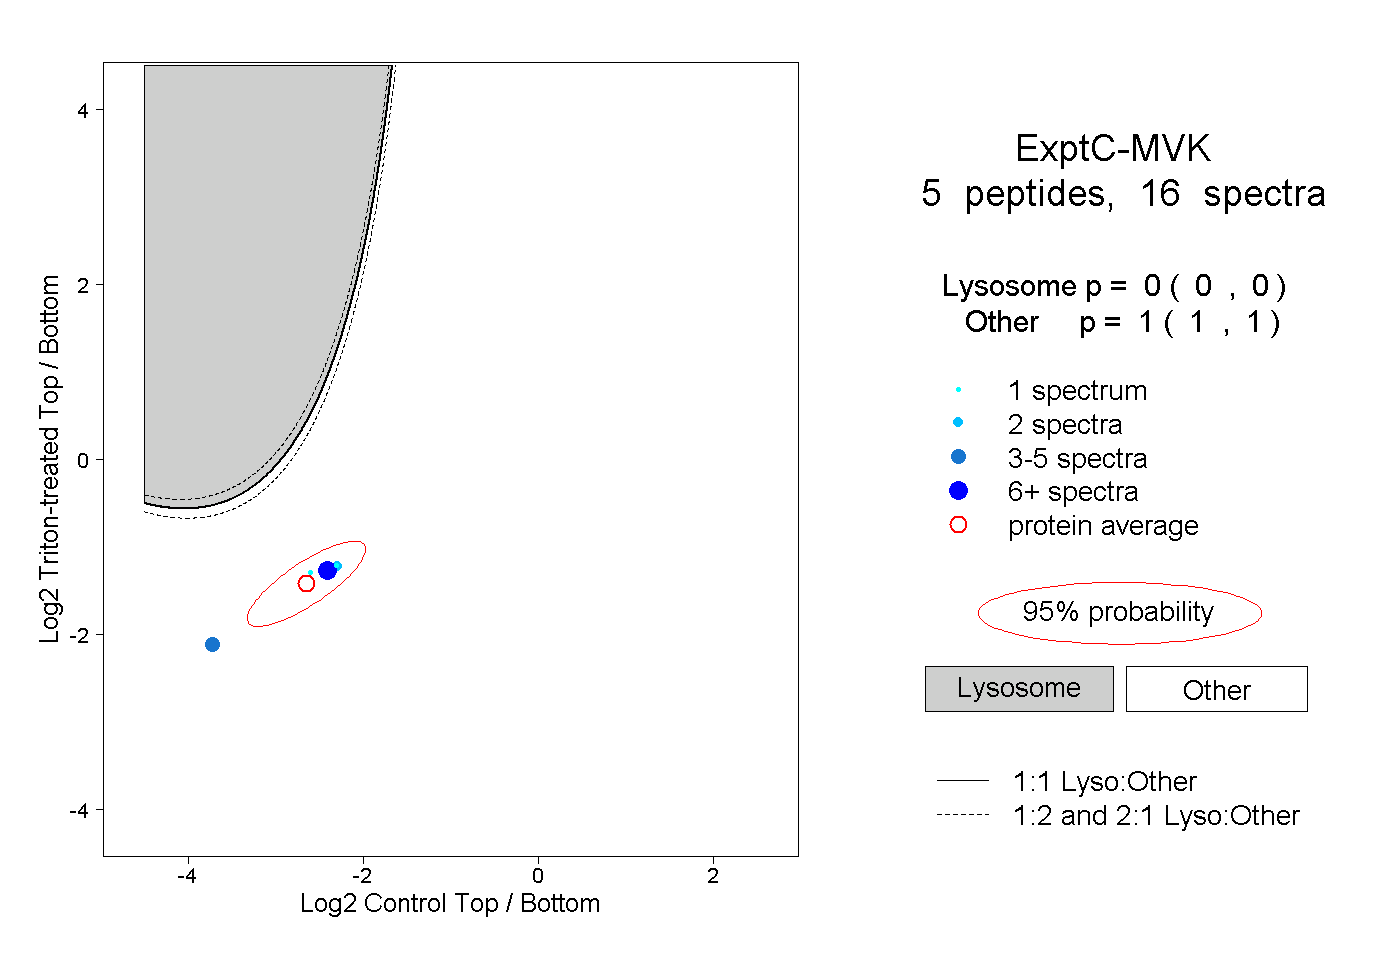
0.000 | 0.000
1.000 | 1.000
1peptide
spectra
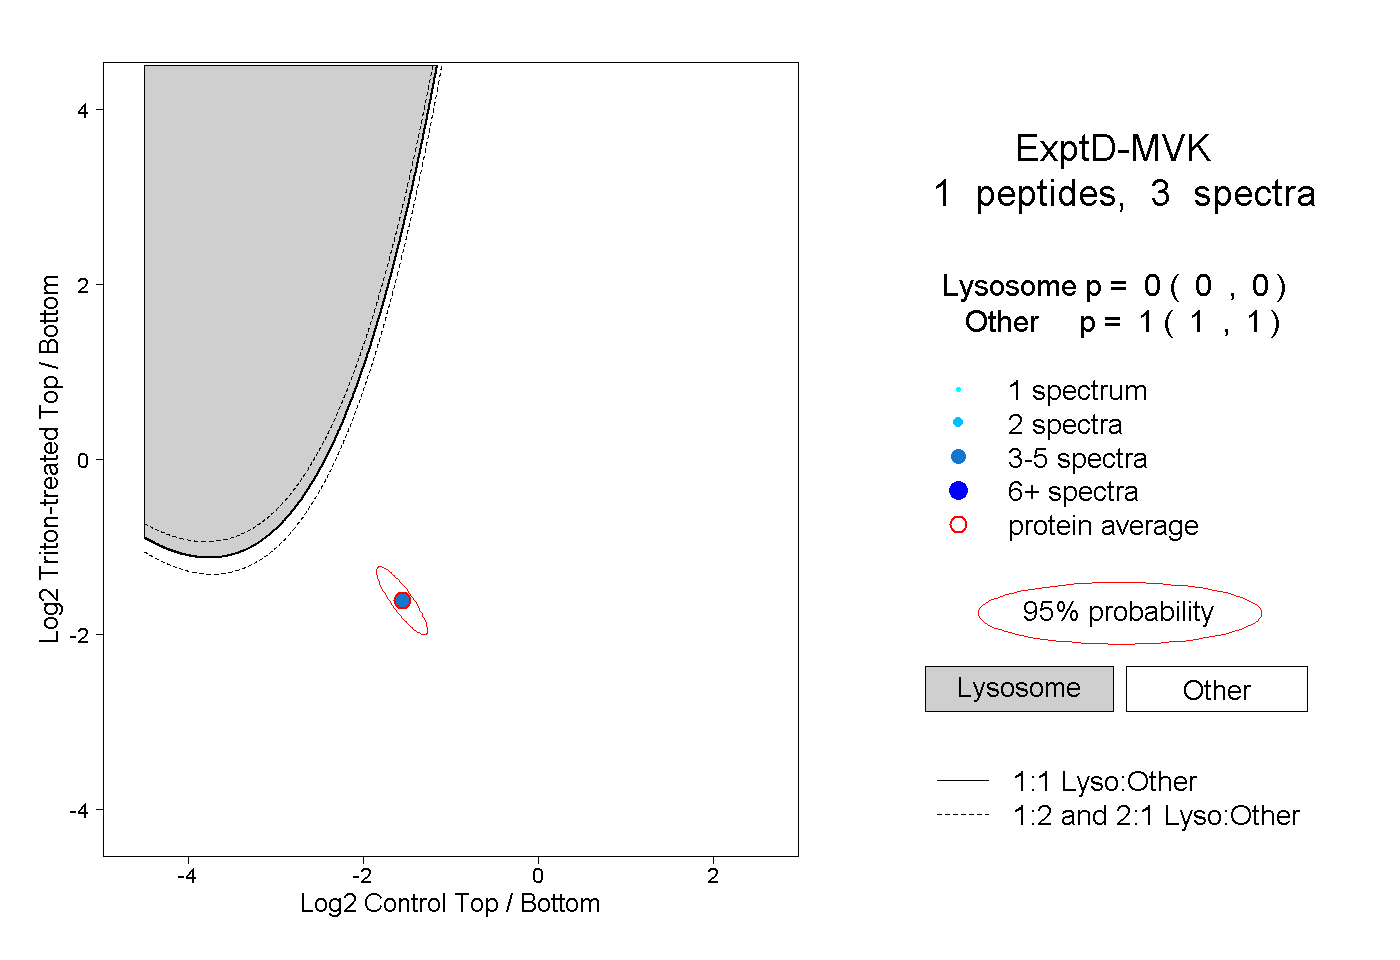
0.000 | 0.000
1.000 | 1.000